. 2012 Nov 29;120(23):4621-34.
doi: 10.1182/blood-2012-05-429506. Epub 2012 Oct 3.

Selective inhibitors of nuclear export show that CRM1/XPO1 is a target in chronic lymphocytic leukemia

Affiliations

Selective inhibitors of nuclear export show that CRM1/XPO1 is a target in chronic lymphocytic leukemia

Rosa Lapalombella et al. Blood. .

Abstract

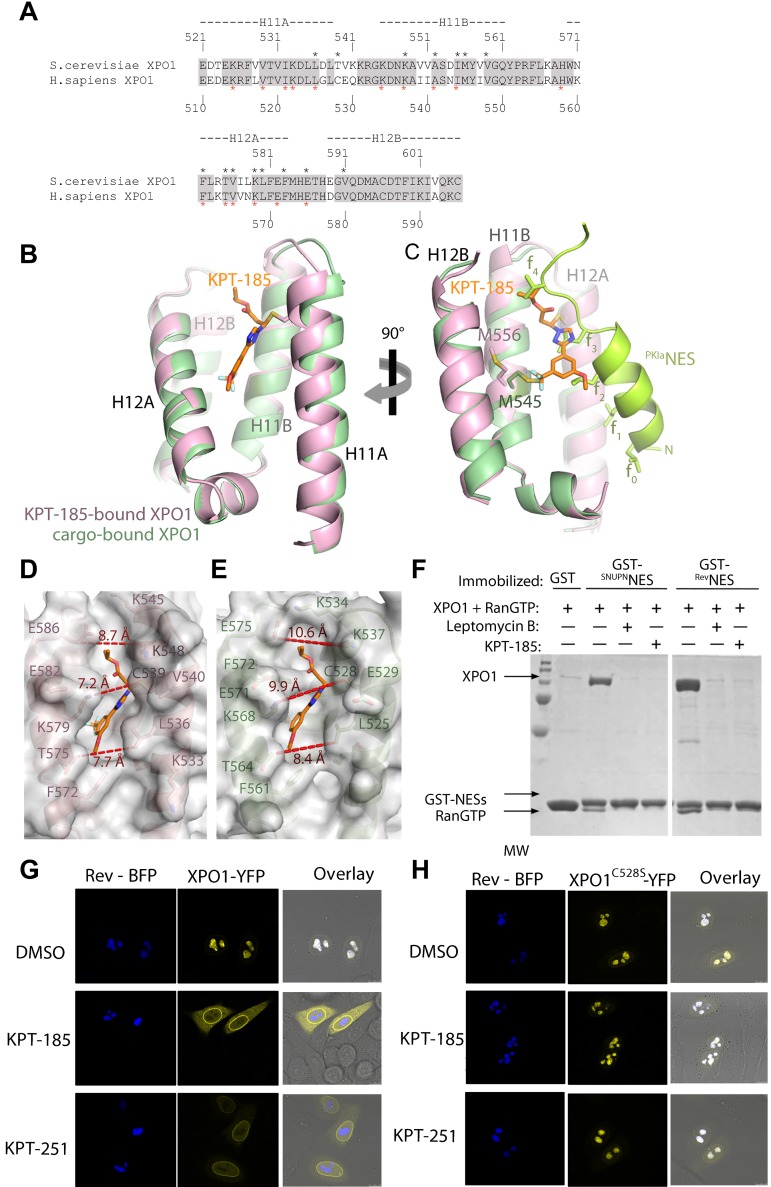
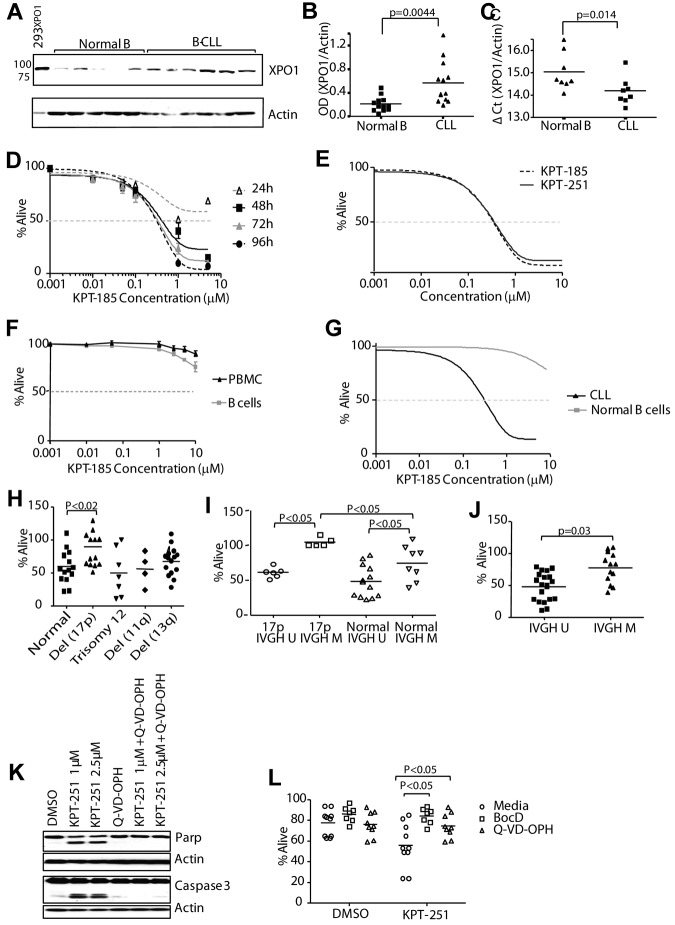
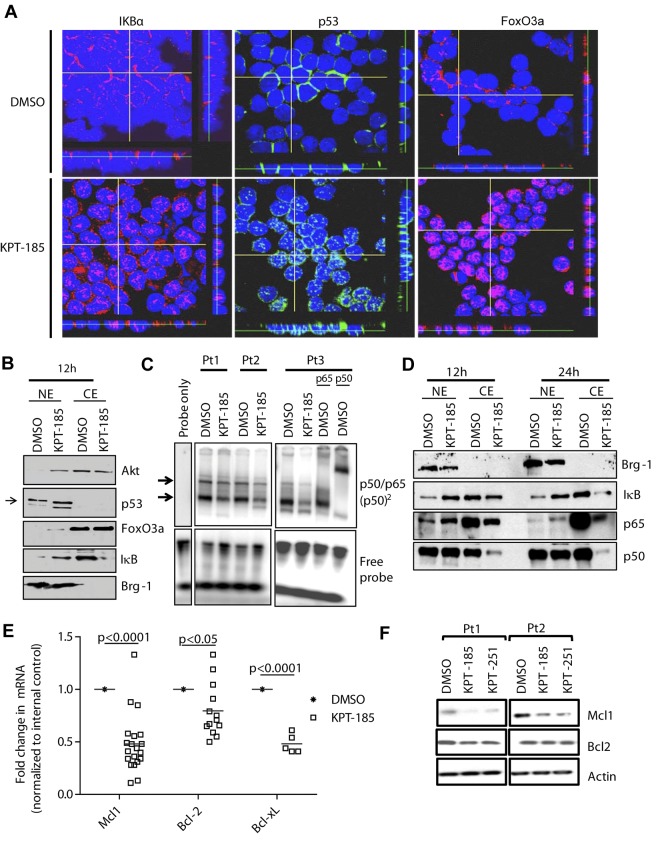
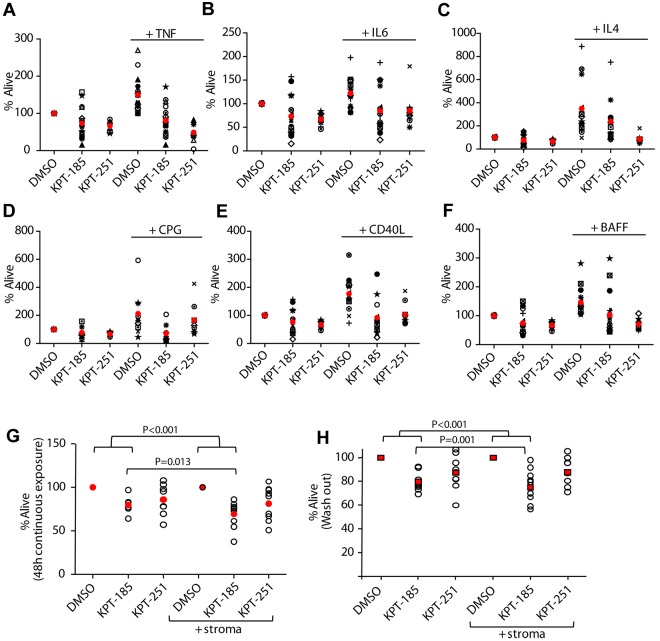
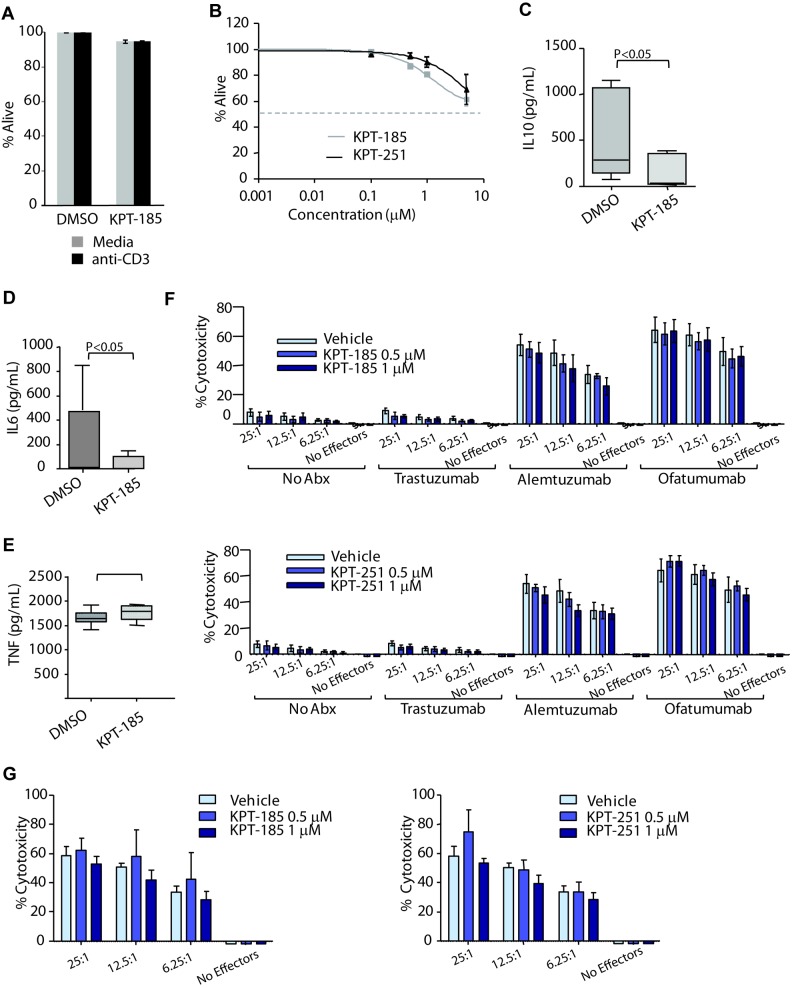
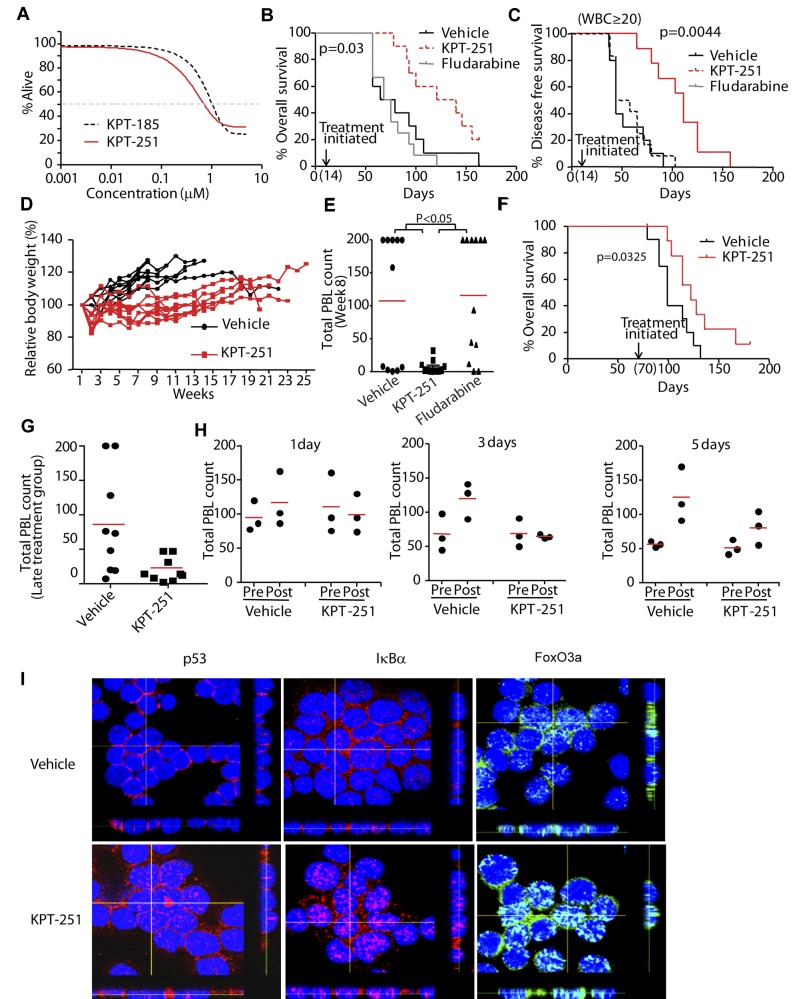
The nuclear export protein XPO1 is overexpressed in cancer, leading to the cytoplasmic mislocalization of multiple tumor suppressor proteins. Existing XPO1-targeting agents lack selectivity and have been associated with significant toxicity. Small molecule selective inhibitors of nuclear export (SINEs) were designed that specifically inhibit XPO1. Genetic experiments and X-ray structures demonstrate that SINE covalently bind to a cysteine residue in the cargo-binding groove of XPO1, thereby inhibiting nuclear export of cargo proteins. The clinical relevance of SINEs was explored in chronic lymphocytic leukemia (CLL), a disease associated with recurrent XPO1 mutations. Evidence is presented that SINEs can restore normal regulation to the majority of the dysregulated pathways in CLL both in vitro and in vivo and induce apoptosis of CLL cells with a favorable therapeutic index, with enhanced killing of genomically high-risk CLL cells that are typically unresponsive to traditional therapies. More importantly, SINE slows disease progression, and improves overall survival in the Eμ-TCL1-SCID mouse model of CLL with minimal weight loss or other toxicities. Together, these findings demonstrate that XPO1 is a valid target in CLL with minimal effects on normal cells and provide a basis for the development of SINEs in CLL and related hematologic malignancies.


Figures

Figure 1
Figure 1
Structure of SINEs bound to XPO1. (A) Chemical structure of KPT-185 and KPT-251 with their heavy atoms numbered. KPT-185 (MW of 355.3) contains a phenyl triazole attached to an isopropyl acrylate via triazole nitrogen. It has good physical properties with cLog P and polar surface area (PSA) of 3.8 and 63.5, respectively. KPT-251 (MW of 375.3), contains a phenyl triazole attached to an oxadiazole ring via a double bond. KPT-251 is a relatively polar compound, and exhibits good physical properties with cLog P and polar surface area (PSA) of 2.5 and 61.9, respectively. (B) The overall structure of the KPT185-ScXPO1*-HsRan-ScRanBP1 complex. A space-filling model of KPT-185 is shown along with XPO1 (pink), Ran (green), and RanBP1 (yellow). (C) The NES-binding groove is located between HEAT repeats H11 and H12, and lined with residues from helices H11A, H11B, H12A and H12B KPT-185 (orange) binds in the NES-binding groove of XPO1 (pink). KPT-185 is oriented with its trifluoromethyl methoxy phenyl group pointing toward the bottom of the XPO1 groove (C-terminal ends of helices H11A and H12A), whereas its isopropyl ester group heads in the opposite direction toward the top of the groove. The activated alkene of KPT-185 is conjugated to the Cys539 sidechain of ScXPO1* through Michael reaction. The methoxy substituent of KPT-185 is partially exposed to solvent but also participates in hydrophobic interactions with the Phe572, Thr575 and Val576 sidechains, which are all located on helix H12A of XPO1. The phenyl ring of KPT-185 is sandwiched between 2 hydrophobic layers. One layer consists of Leu536 and Ile555 sidechains and the other layer consists of the Phe 583 sidechain and the aliphatic portion of the Lys579 sidechain. The triazole ring of KPT-185 is surrounded by hydrophobic XPO1 sidechains sandwiched by Leu536, Cys539 and Ile555 sidechains on one side and the edge of the Phe583 ring on the other. The nitrogen atoms in the triazole ring of KPT-185 make no polar contacts but participate in van der Waals contacts with XPO1 residues. Similarly, polar moieties in the isopropyl ester of KPT-185 make no polar contact with XPO1. The isopropyl ester binds near the top of the XPO1 groove lying close to the floor of the groove with its carbonyl pointing toward solvent and its isopropyl group interacting with the Phe583 and Glu586 sidechains that are located at the C-terminal end of helix H12A. Select inhibitor-XPO1 interactions (< 4Å) are shown with dashed lines. (D-E) Conformational changes in the NES-binding groove of XPO1. (D) The NES-binding groove of XPO1 in the inhibitor-free ScXPO1-Ran-RanBP1 complex (3M1l) is shown as surface representation. The helices and select side chains below the surface are shown in cyan. No ligand is bound in the groove of this XPO1 complex but KPT-185 (placed from superposition of XPO1 residues 570-605 of the ScXPO1-Ran-RanBP1 and the KPT-185-ScXPO1*-Ran-RanBP1 structures) is shown as a reference to facilitate comparison with (E). (E) The NES-binding groove of XPO1 in the KPT-185-ScXPO1*-Ran-RanBP1 complex is shown as surface representation. The helices and select sidechains below the surface are shown in pink and KPT-185 is shown as a stick figure in orange.
Figure 2
Figure 2
Comparison of the inhibitor and NES-bound grooves. (A) Sequence alignment of NES-binding grooves (HEAT repeats H11 and H12) of S cerevisiae XPO1 and human XPO1. Identical residues are shaded in gray, residues that contact KPT-185 are marked with black asterisks, and residues that contact the PKINES (3NBY) are marked with red asterisks. (B) Superposition of the KPT-185 (pink) and PKINES-bound (green) grooves. KPT-185 (orange) and Cys539 of ScXPO1* (pink) are shown as sticks. (C) Same view as in (B), but rotated 90° about the vertical axis and helices H12A of both grooves were removed to obtain a clear side view of the ligands in the groove. The PKINES and its hydrophobic sidechains are colored bright green. (D-E) Surface representations of the KPT-185 (D) and PKINES-bound XPO1 grooves (E). Distances across the openings of the grooves are shown in red. The 13-residue long PKINES peptide is substantially larger than KPT-185 and occupies the entire groove, burying 1117 Å2 whereas KPT-185 buries only 420 Å2 of the XPO1 groove. When the PKINES and KPT-185–bound grooves are superimposed, it is obvious that hydrophobic residues 2, 3, and 4 of the peptide overlap with the inhibitor. Two overlaps with methoxy group, 3 with the triazole, and 4 overlaps with the terminal oxadiazole group of KPT-185.(F) KPT-185 inhibits XPO1-cargo interactions. Approximately 15 μg of GST-NESs were immobilized on glutathione sepharose and then incubated with 10μM XPO1 proteins that were preincubated with either buffer or inhibitors (20μM LMB or 200μM KPT-185) and molar excess of RanGTP. After extensive washing, a fraction of the bound proteins was visualized by SDS-PAGE and Coomasie blue staining. (G) HeLa cells expressing Rev-BFP and/or wild-type XPO1-YFP were analyzed by confocal fluorescence microscopy. Rev-BFP localizes in the nucleoli of the cells, whereas XPO1-YFP is mainly found at the nuclear rim. In cells coexpressing both Rev-BFP and XPO1-YFP, XPO1 is redistributed to the Rev-containing nucleoli and colocalizes with Rev-BFP. Two hours after addition of SINEs the colocalization of XPO1-YFP with Rev-BFP in the nucleoli was analyzed. Both compounds disrupt the wild-type XPO1-YFP colocalization with Rev-BFP, although they had no effect when a mutant XPO1-YFP (C528S) was used as shown in panel H.
Figure 3
Figure 3
KPT-185 induces selective cytotoxicity in CLL cells. (A) CD19+ cells from CLL patients (N = 13) and normal donors (N = 12) were examined for XPO1 expression by immunoblot. Results are shown from 1 of 2 identical experiments. (B) Data analysis of band intensities measured in 2 immunoblots of CLL patient and normal B-cell samples (XPO1/actin ratio). (C) RNA was extracted from CD19+ cells from CLL patients (N = 8) or normal donors (N = 8). XPO1 expression was determined by real-time RT-PCR analysis. Ct values are relative to actin. Higher relative Ct values represent lower gene expression. (D) KPT-185 induces a time and dose-dependent cytotoxicity of CLL cells as measured by MTS assay (N = 10 per timepoint). (E) KPT-185 and KPT-251 induce comparable level of cytotoxicity of CLL cells at 72-hour time-point as measured by MTS assay (N = 6 each). (F) KPT-185 is not cytotoxic to normal PBMC and isolated B cells as measured by annexin-V/PI flow cytometry (N = 6 each). (G) Comparison of the cytotoxic effect of KPT-185 on CLL versus normal B cells as measured by MTS assay (N = 8 each). (H-J) Cytogenetic abnormalities and IVGH mutational status were examined for differences in response to KPT-185 of CLL cells. (K-I) Treatment with SINEs promotes cell death through a caspase-dependent pathway. CLL patient cells were treated with various concentrations of KPT-251 for 12 or 24 hours in presence or absence of the caspase inhibitor Q-VD-OPH. Lysates derived from these cells (12 hours) were assessed for cleavage of PARP and caspase 3 by immunoblot analysis. (L) Apoptosis was measured at 24 hours by annexin-V/PI flow cytometry.
Figure 4
Figure 4
SINEs-specifically inhibit nuclear export. (A) Confocal fluorescence microscopy for p53, FoxO3a, and IκB show time-dependent increases in nuclear levels of these proteins in KPT-185 treated cells compared with vehicle control. Results shown are representative of 5 experiments. Z stacks were collected (0.4 μm per slice) and images were chosen from the middle of nuclei. Side views (across bottom and side of figures) are also shown. (B) Nuclear and cytosolic fractions were isolated from KPT-185 treated CLL cells (12 and 24 hours) and analyzed by immunoblot for AKT, FoxO3a, IκB, p53, and BRG1. Results shown are from 1 representative patient sample. (C) CD19+ cells from CLL patients (N = 3) were incubated with 1μM KPT-185 for 12 hours. EMSA was done with nuclear extract using a radio-labeled oligonucleotide containing a consensus NF-κB binding site. KPT-185–treated samples were also incubated with antibodies specific to the p65 or p50 subunits of NF-κB. The p65/p50 complex is indicated by arrows. Results are shown from 3 of 3 experiments. (D) Nuclear and cytosolic fractions were isolated from KPT-185 treated CLL cells (12 and 24 hours) and analyzed by immunoblot for p50 and p65, and BRG-1. Results shown are from 1 representative patient sample. (E) Real-time RT-PCR for Mcl1, Bcl-2, and Bcl-xL after 12 hours (0.5μM) KPT-185 treatment. Data are normalized to 18S transcript and represented as fold change in expression of KPT-185 treated relative to the vehicle control. Squares represent individual patient samples, and horizontal bars represent the average. (F) Whole cell expression of Mcl1 and Bcl-2. Results shown are from 2 representative patient samples.
Figure 5
Figure 5
SINEs antagonize microenvironment stimuli. CD19+ cells from CLL patients (N = 10) were incubated with or without 1μM KPT-185 or KPT-251 for 72 hours in presence or absence of (A) 20 ng/mL TNF, (B) 40 ng/mL IL-6, (C) 800 U/mL IL-4, (D) 3μM of CPG, (E) 1 μg/mL CD40L, and (F) 50 ng/mL BAFF. (G) CD19+ cells from CLL patients were isolated from peripheral blood and incubated with or without KPT-185 or KPT-251 (1 and 2.5μM) in suspension or on an HS5 cell layer for 48 hours. Viability was determined by annexin-V/PI flow cytometry, and is shown relative to time-matched DMSO controls for each group. Red circles represent averages. (H) CD19+ cells from CLL patients were isolated from peripheral blood and incubated with or without KPT-185 or KPT-251 (1 and 2.5μM) for 12 hours. Drug was then washed out and cells were incubated in suspension or on an HS5 cell layer for additional 48 hours. Viability was determined by annexin-V/PI flow cytometry, and is shown relative to time-matched DMSO controls for each group. Horizontal bars represent averages.
Figure 6
Figure 6
SINEs do not alter T cell or NK cell viability but negatively influences IL-6 and IL-10 production. (A) CD3+ T cells (N = 6) from normal volunteers were incubated with or without 1μM of KPT-185 for 48 hours. Cells were stimulated using an anti-CD3 T-cell activation plate for additional 24 hours. Cells viability (ann/PI negative cells) was measured by annexin-V/PI flow cytometry and was calculated relative to time-matched untreated controls. (B) CD56+ NK cells (N = 6) from normal volunteers were incubated with or without KPT-185 for 72 hours. Viability was measured by annexin-V/PI flow cytometry and was calculated relative to time-matched untreated controls. (C-E) Supernatant from anti-CD3 stimulated T cells treated with or without 1μM of KPT-185 for 48 hours was collected and IL-6, IL-10, and TNF-α production were measured by ELISA. (F) ADCC against CLL cells was measured using KPT-185 or KPT-251–treated NK cells (12 hours) from normal volunteers and CLL cells at 6.25:1, 12.5:1, and 25:1 effector to target ratio (E:T) in the presence or absence of 10 μg/mL ofatumumab, alemtuzumab, or trastuzumab. Columns are averages of triplicate wells, and are representative of 3 independent experiments; bars represent SD. (G) NK directed cytotoxicity against K562 cells was measured using KPT-185 or KPT-251–treated NK cells (12 hours) from normal volunteers and K562 cells at E:T ratios of 6.25:1, 12.5:1, and 25:1. Columns are averages of triplicate wells and are representative of 3 independent experiments; bars represent SD.
Figure 7
Figure 7
SINEs prolong survival in a mouse model of CLL. (A) KPT-185 and KPT-251 induce similar dose-dependent cytotoxicity of murine TCL1 leukemia cells as measured by MTS assay (N = 14). (B) Overall survival (OS) curve for TCL1-SCID mice treated with 75 mg/kg KPT-251 (N = 10), 34 mg/kg fludarabine (n = 12), or vehicle control (N = 10). Treatment was initiated 14 days after engraftment. Median OS: 130.5 days (KPT-251), 72 days (vehicle), and 71.5 days (fludarabine). (C) Progression-free survival (PFS) curve, with progression defined as increase in circulating CLL (CD19+/TCL1+) cells to > 20 000/μL. Median PFS = 111, 44, and 51 days for KPT-251, vehicle and fludarabine, respectively. (D) Body-weight changes for experiment shown in panel B (KPT-251 and fludarabine-treated mice). (E) Peripheral blood count (PBL) in KPT-251, fludarabine, and vehicle control-treated TCL1-SCID mice. Count was determined by hematoxylin and eosin-stained peripheral blood smear at day 56 (week 8) after initiation of treatment. (F) Overall survival curve for TCL1-SCID mice treated with 75 mg/kg KPT-251 (N = 10) or vehicle control (N = 10). Treatment was initiated 70 days after engraftment. Median survival = 122 days, and 99 days for KPT-251 and vehicle, respectively. (G) PBL counts from TCL1-SCID mice treated 70 days after engraftment with 75 mg/kg KPT-251 or vehicle control (N = 10). Count was determined by hematoxylin and eosin-stained peripheral blood smear. Graph shows last count available for each animal. (H) PBL in TCL1-SCID mice before and 1, 3, or 5 days after administration of a single dose of KPT-251 or vehicle control. Count was determined by hematoxylin and eosin-stained peripheral blood smear. (I) Confocal fluorescence microscopy for p53, FoxO3a, and IκB in tumor cells isolated from mice treated with a single dose of KPT-251 or vehicle control for 72 hours. Results shown are representative of 3 experiments. Z stacks were collected (0.4 μm per slice) and images were chosen from the middle of nuclei. Side views (across bottom and side of figures) are also shown to depict the nuclear localization of p53, FoxO3a, and IκB in the cells.

References

    1. Xu D, Farmer A, Chook YM. Recognition of nuclear targeting signals by Karyopherin-beta proteins. Curr Opin Struct Biol. 2010;20(6):782–790. - PMC - PubMed
    1. Güttler T, Gorlich D. Ran-dependent nuclear export mediators: a structural perspective. EMBO J. 2011;30(17):3457–3474. - PMC - PubMed
    1. Dong X, Biswas A, Suel KE, et al. Structural basis for leucine-rich nuclear export signal recognition by CRM1. Nature. 2009;458:1136–1141. - PMC - PubMed
    1. Yao Y, Dong Y, Lin F, et al. The expression of CRM1 is associated with prognosis in human osteosarcoma. Oncol Rep. 2009;21(1):229–235. - PubMed
    1. Monecke T, Guttler T, Neumann P, Dickmanns A, Gorlich D, Ficner R. Crystal structure of the nuclear export receptor CRM1 in complex with Snurportin1 and RanGTP. Science. 2009;324(5930):1087–1091. - PubMed

Publication types

MeSH terms