. 2012 Nov;30(11):1137-42.
doi: 10.1038/nbt.2401. Epub 2012 Oct 3.

Ribozyme-based insulator parts buffer synthetic circuits from genetic context

Affiliations

Ribozyme-based insulator parts buffer synthetic circuits from genetic context

Chunbo Lou et al. Nat Biotechnol. 2012 Nov.

Abstract

Synthetic genetic programs are built from circuits that integrate sensors and implement temporal control of gene expression. Transcriptional circuits are layered by using promoters to carry the signal between circuits. In other words, the output promoter of one circuit serves as the input promoter to the next. Thus, connecting circuits requires physically connecting a promoter to the next circuit. We show that the sequence at the junction between the input promoter and circuit can affect the input-output response (transfer function) of the circuit. A library of putative sequences that might reduce (or buffer) such context effects, which we refer to as 'insulator parts', is screened in Escherichia coli. We find that ribozymes that cleave the 5' untranslated region (5'-UTR) of the mRNA are effective insulators. They generate quantitatively identical transfer functions, irrespective of the identity of the input promoter. When these insulators are used to join synthetic gene circuits, the behavior of layered circuits can be predicted using a mathematical model. The inclusion of insulators will be critical in reliably permuting circuits to build different programs.


Figures

Figure 1
Figure 1
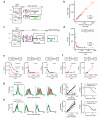
The transfer function of the NOT gate depends on the inducible system used to measure it. (a) Three inducible systems were connected to the NOT gate: pTAC, pLlacO-1 and pBAD. The NOT gate is based on the cI gene, which represses the pOR1 promoter. (b) The promoter activity of each inducible system is determined using gfp as a reporter alone and fused to the cI gene. (c) Data gathered using the constructs from parts a and b are used to determine the transfer function of the NOT gate. The transfer functions are shown as measured by the inducible systems of a. Each point represents one concentration of inducer that corresponds to expression from pOR1 (part (a)) and the output promoter of the inducible system (part (b)). The inducer concentrations are: pTAC, 0, 0.1, 1, 5, 10, 20, 30, 40, 50, 70, 100 μM IPTG; pLlacO-1, 0.1, 1, 10, 50, 100, 150, 200, 300, 500, 1,000, 2,000, 3,000 μM IPTG; and pBAD, 0, 0.1, 1, 2, 5, 7, 10, 12.5, 25, 37.5, 50, 62.5 mM Ara. (d) The fluorescence measured from each inducible promoter driving the expression of gfp is compared to cI-gfp (part (b)). The expression ratios are the slope of each line: 2.6 (pTAC) and 0.3 (pBAD). Expression point represents a single concentration of inducer. Error bars, mean ± s.d. obtained from at least three experiments performed on different days.
Figure 2
Figure 2
Screening the library of insulator parts. (a) The screen is based on the comparison of expression between inserted into both of these contexts, thus requiring 108 constructs. (b) Screening data are shown for the full library of insulators. Each line is a different insulator and each point is the fluorescence from the pair of constructs in part a at 0, 5, 50, 100, 300 or 1,000 μM IPTG. The solid black lines mark the upper (slope, 6.5) and lower (slope, 0.12) bounds of the distribution of insulators (pJ5J and DG131aRBS, respectively, in Supplementary Table 2). The blue curve corresponds to the behavior of pLlacO-1 without an insulator. (c) Under the pTAC promoter, RiboJ cleaves after the +34 nucleotide, thus removing the 5' sequence from the promoter (+1 to +28). The primer used for the 5'RACE experiments is shown. (d) The agarose gel result for the cleaved mRNA and its controls. The gel result is for the amplified DNA samples that were reverse-transcribed from mRNA templates according to the 5'RACE protocol (Online Methods). In the presence of RiboJ, the TAP-T4PNK-untreated sample has two faint bands (lane 5), but the TAP-T4PNK-treated sample has one heavy dark band (lane 1). In the absence of RiboJ, the TAP-T4PNK-treated (lane 6) and TAP-T4PNK-untreated (lane 2) samples, respectively, have a weak or dark band. (e) 5'RACE sequencing data. All sequences are the complementary DNA sequences of RNA. The sequencing result of 5'RACE is for the DNA sample in lane 1 of d and read from an internal primer of the mRNA to the 5'-end. ‘RNA adapter’ is the reverse complementary DNA sequence of the RNA adaptor. The underlined sequence is removed from the mRNA by the ribozyme after the defined “G” site.
Figure 3
Figure 3
RiboJ and other insulators insulate the transfer function of the NOT and BUFFER gates. (a) The constructs from Figure 1b rebuilt to contain the RiboJ sequence between the output promoters of the inducible systems and the gfp and cI-gfp reporters. (b) The ratio between GFP and CI-GFP expression collapse onto a single curve for each inducible system. The concentrations of inducer are identical to those in Figure 1c. (c) The RiboJ insulator inserted upstream of the NOT gate for the three inducible systems. (d) The collapse of the data onto a single transfer function. The experiments are identical to those shown in Figure 1c. Error bars, mean ± s.d. of at least three experiments performed on different days. (e) The transfer functions of McbR NOT gate with and without the RiboJ and LtsvJ insulators. The transfer functions were measures using the pTACsym (red circles) and pSAL (black square) inducible systems. Their inducer concentrations are: pTACsym, 0, 0.1, 1, 5, 10, 20, 50, 100, 200, 500, 1,000, 2,000 mM IPTG and pSAL, 0, 0.1, 0.2, 0.5, 1, 2, 5, 10, 20, 50, 100, 200 mM salicylate. The reporter gene of the two new gates is yfp. (f) The transfer functions of R73d BUFFER gate with and without RiboJ. (g) The experimental data are compared to the predicted distribution when RiboJ is not included in the circuit. The inducer concentrations are (left to right): 0.1, 5, 10, 50 mM Ara. The hashed red lines show the difference between the predicted and measured distributions. Right: quantitative comparisons of distributions where the probability is divided into 30 bins for each curve. The data fit poorly to a line with slope of unity (R2 = –0.30). (h) Same as g, but inclusion of RiboJ improves the predictability of the assembled circuit. The comparison between the predicted and experimental follows a linear fit (R2 = 0.89). Far right, for g and h, the experimental mean and predicted mean of the probability distributions.

Comment in

References

    1. Kim PM, Tidor B. Limitations of quantitative gene regulation models: a case study. Genome Res. 2003;13:2391–2395. - PMC - PubMed
    1. Del Vecchio D, Ninfa AJ, Sontag ED. Modular cell biology: retroactivity and insulation. Mol. Syst. Biol. 2008;4:161. - PMC - PubMed
    1. Grünberg R, Serrano L. Strategies for protein synthetic biology. Nucleic Acids Res. 2010;38:2663–2675. - PMC - PubMed
    1. Tan C, Marguet P, You L. Emergent bistability by a growth-modulating positive feedback circuit. Nat. Chem. Biol. 2009;5:842–848. - PMC - PubMed
    1. Ellis T, Wang X, Collins JJ. Diversity-based, model-guided construction of synthetic gene networks with predicted functions. Nat. Biotechnol. 2009;27:465–471. - PMC - PubMed

Publication types

MeSH terms