. 2013 Jan;109(1):249-60.
doi: 10.1152/jn.00527.2012. Epub 2012 Oct 3.

High-performance execution of psychophysical tasks with complex visual stimuli in MATLAB

Affiliations

High-performance execution of psychophysical tasks with complex visual stimuli in MATLAB

Wael F Asaad et al. J Neurophysiol. 2013 Jan.

Abstract

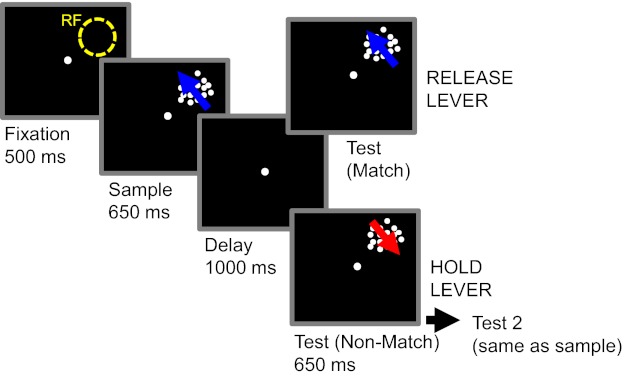
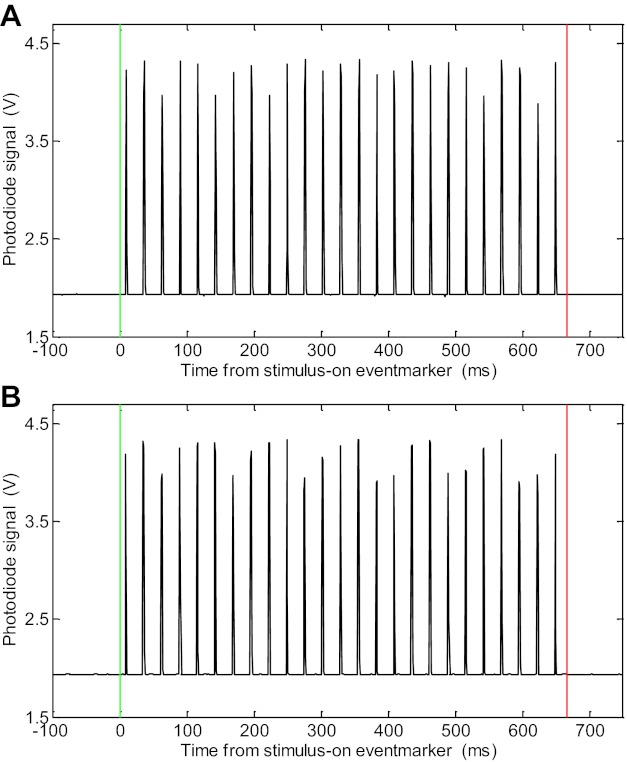
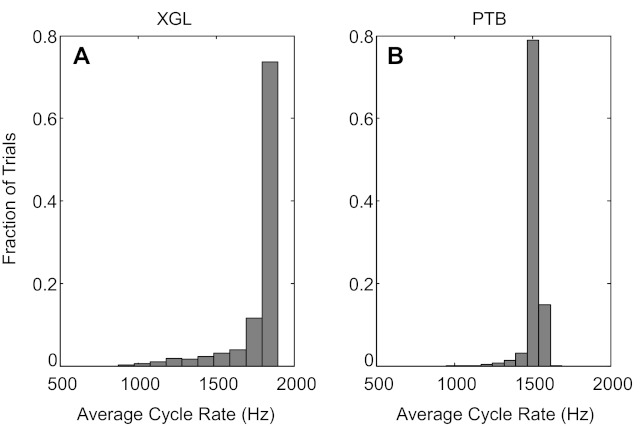
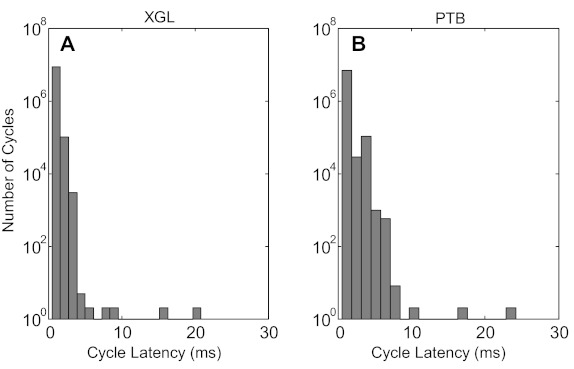
Behavioral, psychological, and physiological experiments often require the ability to present sensory stimuli, monitor and record subjects' responses, interface with a wide range of devices, and precisely control the timing of events within a behavioral task. Here, we describe our recent progress developing an accessible and full-featured software system for controlling such studies using the MATLAB environment. Compared with earlier reports on this software, key new features have been implemented to allow the presentation of more complex visual stimuli, increase temporal precision, and enhance user interaction. These features greatly improve the performance of the system and broaden its applicability to a wider range of possible experiments. This report describes these new features and improvements, current limitations, and quantifies the performance of the system in a real-world experimental setting.


Figures

Fig. 1.
Fig. 1.
The behavioral task used to study movie performance. The subject performed a delayed match-to-sample task and had to indicate (by releasing a lever) whether sample and test stimuli were identical matches. If the sample and test were not identical, the subject had to wait until a 3rd stimulus was presented, which was always an identical match to the sample (and required a lever release). Sample and test stimuli were both high-contrast, random-dot movies on a gray background. The location of the receptive field (RF) of a neuron is indicated by the dotted yellow circle.
Fig. 2.
Fig. 2.
Photodiode verification of video performance during movie presentation in the XGL (A) and Psychophysics Toolbox (PTB; B) versions of the software. The black trace indicates the voltage recorded from the output of a photodiode circuit with the photodiode sensor affixed to the display screen (near the center of the display). The green and red lines indicate the timing of the stimulus-on and stimulus-off event markers, respectively. The movie consisted of alternating “white” and “black” frames, and frames were played at a rate of 75 Hz. The interval between the green line and 1st upward deflection of the photodiode signal was ∼8.0 ms, which is consistent with the frame rate and the position of the photodiode near the center of the display.
Fig. 3.
Fig. 3.
Histogram of average cycle rates across all movie trials. A: the average cycle rate across 3,400 movie trials using XGL was 1,767 Hz. The average cycle rate during the 1st trial was 1,785 Hz, nearly double the 913 Hz reported for images in the previous report (Asaad and Eskandar 2008b) despite having additional processing requirements. 99% Of trials had an average cycle rate >1,100 Hz. 0.32% Of trials had average cycle rates <1,000 Hz, and the lowest average cycle rate across all trials was 873.5 Hz. B: the average cycle rate across 2,600 movie trials using PTB was 1,503 Hz. The average cycle rate during the 1st trial was 1,431 Hz. 99% Of trials had an average cycle rate >1,200 Hz. 0.04% Of trials had average cycle rates <1,000 Hz, and the lowest average cycle rate across all trials was 948.5 Hz.
Fig. 4.
Fig. 4.
Histogram of cycle latencies across all trials. A: average cycle latency across all 3,400 trials for XGL was 0.56 ms. 99.9% Of cycles had a latency of <2 ms. Here, we exclude 2 cycles with latency 101 ms (0.00002% of all cycles). B: average cycle latency across all 2,600 trials for PTB was 0.71 ms. 99.9% Of cycles had a latency of <5 ms.
Fig. 5.
Fig. 5.
Cycle latencies for a typical behavioral tracking epoch on a single example trial using XGL (top) and PTB (bottom) stimulus presentation frameworks. During these example trials, 2 inputs (eye position and button status) are being monitored by the track routine, and movie stimuli are displayed. The black trace indicates individual cycle latencies for all cycles in the trial. The green vertical lines indicate cycles during which the toggle subfunction is called. The blue vertical lines indicate cycles in which the control screen is updated. The red vertical lines indicate cycles in which the control screen is updated and the toggle subfunction is called.
Fig. 6.
Fig. 6.
Average latency of processes in the track function. The bars show the time required for different combinations of behavioral inputs, and video operations in track using XGL (gray) and PTB (white) stimulus presentation frameworks are shown. Each process consisted of monitoring 1 or 2 inputs (“in”) while track simultaneously performed updates to the experimenter's control screen (“CS”) and toggled movie stimuli on the subject's screen (“TOG”). Error bars represent standard deviation.
Fig. 7.
Fig. 7.
The behavioral task used to study image performance. The subject performed a delayed match-to-category task and had to indicate (by releasing a lever) whether sample and test stimuli were of the same category, novel or familiar. If the sample and test were not identical, the subject had to wait until a 3rd stimulus was presented, which was always the same category as the sample (and required a lever release). Sample and test stimuli were both full-color RGB images.
Fig. 8.
Fig. 8.
Histogram of average cycle rates across all image trials. A: average cycle rate across 2,400 image trials using XGL was 1,883 Hz. The average cycle rate during the 1st trial was 1,898 Hz, more than double the 913 Hz reported for images in the previous report (Asaad and Eskandar 2008b). 99% Of trials had an average cycle rate >1,700 Hz. 0.04% Of trials had average cycle rates <1,200 Hz, and the minimum average cycle rate across all trials was 1,157.3 Hz. B: average cycle rate across 1,500 image trials using PTB was 1,435 Hz. The average cycle rate during the 1st trial was 1,436 Hz. 99% Of trials had an average cycle rate >1,350 Hz. 0.07% Of trials had average cycle rates <1,200 Hz, and the minimum average cycle rate across all trials was 1,179 Hz.
Fig. 9.
Fig. 9.
Comparison between time stamps and number of samples acquired from a hardware device. The toc function (black) and SamplesAvailable (gray) are shown here. Toc is used to provide time stamps during data acquisition, and SamplesAvailable (a property of MATLAB Data Acquisition Toolbox) indicates the number of samples collected from the hardware device.

References

    1. Asaad WF, Eskandar EN. Achieving behavioral control with millisecond resolution in a high-level programming environment. J Neurosci Methods 17: 235–240, 2008a - PMC - PubMed
    1. Asaad WF, Eskandar EN. A flexible software tool for temporally-precise behavioral control in MATLAB. J Neurosci Methods 174: 245–248, 2008b - PMC - PubMed
    1. Brainard DH. The Psychophysics Toolbox. Spat Vis 10: 433–436, 1997 - PubMed
    1. Gardner J, Larsson J. MGL Toolbox. In: Gardner Research Unit | mgl:overview (Online). http://gru.brain.riken.jp/doku.php/mgl/overview, 2012
    1. Kleiner M, Brainard D, Pelli D. What's new in Psychtoolbox-3? Perception 36, ECVP Abstract Suppl: 2007

Publication types

LinkOut - more resources