. 2013 Jan;109(1):124-36.
doi: 10.1152/jn.00785.2012. Epub 2012 Oct 3.

Changes in corticospinal excitability during reach adaptation in force fields

Affiliations

Changes in corticospinal excitability during reach adaptation in force fields

Jean-Jacques Orban de Xivry et al. J Neurophysiol. 2013 Jan.

Abstract

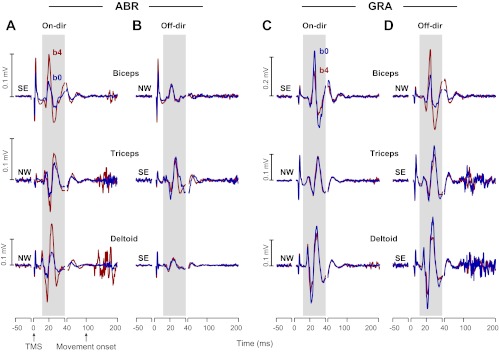
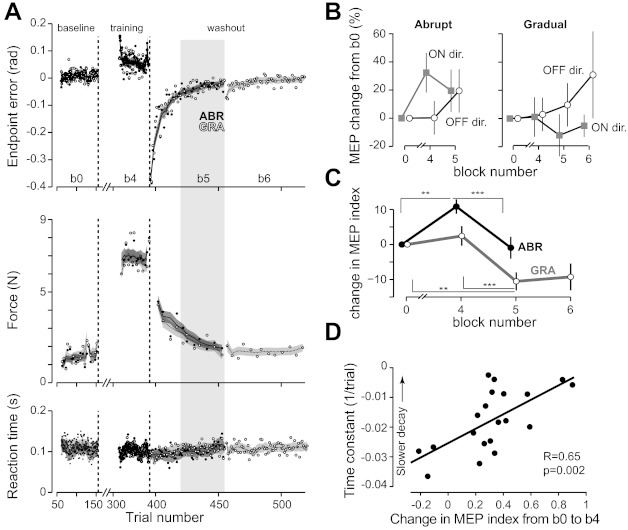
Both abrupt and gradually imposed perturbations produce adaptive changes in motor output, but the neural basis of adaptation may be distinct. Here, we measured the state of the primary motor cortex (M1) and the corticospinal network during adaptation by measuring motor-evoked potentials (MEPs) before reach onset using transcranial magnetic stimulation of M1. Subjects reached in a force field in a schedule in which the field was introduced either abruptly or gradually over many trials. In both groups, by end of the training, muscles that countered the perturbation in a given direction increased their activity during the reach (labeled as the on direction for each muscle). In the abrupt group, in the period before the reach toward the on direction, MEPs in these muscles also increased, suggesting a direction-specific increase in the excitability of the corticospinal network. However, in the gradual group, these MEP changes were missing. After training, there was a period of washout. The MEPs did not return to baseline. Rather, in the abrupt group, off direction MEPs increased to match on direction MEPs. Therefore, we observed changes in corticospinal excitability in the abrupt but not gradual condition. Abrupt training includes the repetition of motor commands, and repetition may be the key factor that produces this plasticity. Furthermore, washout did not return MEPs to baseline, suggesting that washout engaged a new network that masked but did not erase the effects of previous adaptation. Abrupt but not gradual training appears to induce changes in M1 and/or corticospinal networks.


Figures

Fig. 1.
Fig. 1.
Experimental methods. A: subjects held the handle of a robotic arm. The device and the arm of the subject were located below an opaque screen on which a cursor representing hand position and the targets were projected. The starting point for each trial was located at the center of an imaginary circle. On a given trial, a target would appear either at 135° [northwest (NW)] or 315° [southeast (SE)]. The perturbation consisted of a counterclockwise curl force field. B: a reach target appeared at 10 cm, and the subject then heard three 100-ms duration auditory tones in sequence. The task was to start the reach 100 ms after the third tone. The third tone coincided with a change in the color of the target, which served as a go cue. Subjects were instructed to shoot through the target as accurately as possible and within a 160- to 220-ms time window after reach start. In 40% of the trials, transcranial magnetic stimulation (TMS) was delivered at the appearance of the go cue. C: subjects performed 7 blocks of 65 trials. From block b2 until the end of the experiment, TMS was delivered over the left primary motor cortex (M1) on 45% of the trials. In the abrupt (ABR) condition, the force field perturbed the movements from trials 156 to 395. In the gradual (GRA) condition, the strength of the force field was ramped up linearly from trials 156 to 340 and was then maintained until trial 395.
Fig. 2.
Fig. 2.
Behavioral results for the ABR and GRA groups. A: end-point error, plotted as the angular distance to the target, as the hand crossed an imaginary 10-cm circle. The dotted vertical lines indicate set breaks, and the dashed vertical line indicates the start of the force field perturbation block. B: maximum force measured during error-clamp trials. C: reaction time with respect to the go cue. In A–C, the curves represent the running average over a window of 10 trials, which were interrupted during set breaks. D: velocity perpendicular to the direction of the target, computed during blocks b0 and b4 (baseline and end of adaptation, as denoted in A). E: force produced in error-clamp trials, computed during blocks b0 and b4. F: running SD of the peak force (from B) obtained as in Orban de Xivry et al. (2011a). Error bars are SEs.
Fig. 3.
Fig. 3.
Electromyographs (EMGs) at baseline (block b0) and final training (block b4). A: EMG for each muscle in the on direction for subjects in the ABR and GRA groups. Traces were aligned to the go cue (time 0). Shaded areas around the traces represent SEs. The gray vertical bar represents the time of the TMS pulse. B: same as in A but for the off direction of movements.
Fig. 4.
Fig. 4.
Motor-evoked potential (MEP) traces for three muscles of two representative subjects during baseline (block b0) and final training (block b4). Each trace is the median of the MEP traces obtained in each block. Top: biceps muscle; middle: triceps muscle; bottom: deltoid. A and B: data for the subject in the ABR group; C and D: data for the subject in the GRA group. For A–D, three different periods are presented: 1) from 50 ms before to the time of the TMS pulse, 2) from the TMS pulse to 40 ms later, and 3) from 40 to 200 ms after the TMS pulse. The MEPs are visible during the second time interval. The shaded area represents the time interval during which the minimum and maximum of the EMG were measured to determine MEP amplitudes. The on direction refers to the direction for which a muscle countered a perturbation.
Fig. 5.
Fig. 5.
Change in MEP during training. A: changes in MEPs of each muscle (with respect to block b0) in the on and off directions. Data represent intersubject averages ± SE for each group (●, ABR group; ○, GRA group). B: changes in MEPs in the on and off directions, pooled across muscles, and plotted over the course of training. Error bars are SEs. C: for each muscle of each subject, MEPs in the on and off directions were combined to form an MEP index (Eq. 1). Next, for each subject, a mean MEP index was computed (Eq. 2) for each block. This plot shows the change in this measure with respect to block b0. Intersubject means ± SE are plotted.
Fig. 6.
Fig. 6.
Changes in EMGs with respect to block b0 (solid circles, ABR group; open circles, GRA group; shaded circles, null group) in various periods before, during, and after the TMS pulse. The prepulse period was 40–10ms before the TMS pulse, the per-pulse period was the period during which a TMS pulse would be given (but was not), and the postpulse period was from movement onset to movement end. For each muscle of each subject, the root mean square of the raw EMG signal in the on and off directions at each period was computed. Next, for each muscle of each subject, an EMG index was computed (Eq. 1). Finally, for each subject, a mean EMG index was computed (Eq. 2). This plot shows the change in this measure with respect to block b0 (means ± SE).
Fig. 7.
Fig. 7.
Analysis of the washout period. A: evolution of the end-point error, maximum perpendicular force, and reaction time during baseline (block b0), end of training (block b4), and washout (blocks b5 and b6). The solid trace and solid circles are for the ABR group, and the dashed trace and open circles are for the GRA group. End-point error was measured in field trials, force was measured in error-clamp trials, and reaction time was measured in all trials. Data for block b6 were obtained for the GRA group only. Lines show the running average over a window of 10 trials. B: changes in MEPs (relative to block b0) in the on and off directions, pooled across muscles, and plotted in various blocks. C: change in the MEP index (relative to block b0) for training and washout blocks for the ABR and GRA conditions. **P < 0.01; ***P < 0.001. D: intersubject correlation between the mean of the MEP index (change between blocks b0 and b4) and the time constant of decay in the perpendicular force measured during error-clamp trials (data from A, middle, block b5). Data from the ABR group (n = 20) are shown.

References

    1. Ahmadi-Pajouh MA, Towhidkhah F, Shadmehr R. Preparing to reach: selecting an adaptive long-latency feedback controller. J Neurosci 32: 9537–9545, 2012 - PMC - PubMed
    1. Allison GT, Marshall RN, Singer KP. EMG signal amplitude normalization technique in stretch-shortening cycle movements. J Electromyogr Kinesiol 3: 236–244, 1993 - PubMed
    1. Arce F, Novick I, Mandelblat-Cerf Y, Vaadia E. Neuronal correlates of memory formation in motor cortex after adaptation to force field. J Neurosci 30: 9189–9198, 2010a - PMC - PubMed
    1. Arce F, Novick I, Mandelblat-Cerf Y, Israel Z, Ghez C, Vaadia E. Combined adaptiveness of specific motor cortical ensembles underlies learning. J Neurosci 30: 5415–5425, 2010b - PMC - PubMed
    1. Blohm G, Keith G, Crawford J. Decoding the cortical transformations for visually guided reaching in 3D space. Cereb Cortex 19: 1372–1393, 2009 - PubMed

Publication types

LinkOut - more resources