. 2012 Dec 15;303(12):C1229-43.
doi: 10.1152/ajpcell.00044.2012. Epub 2012 Oct 3.

Increased TMEM16A-encoded calcium-activated chloride channel activity is associated with pulmonary hypertension

Affiliations

Increased TMEM16A-encoded calcium-activated chloride channel activity is associated with pulmonary hypertension

Abigail S Forrest et al. Am J Physiol Cell Physiol. .

Abstract

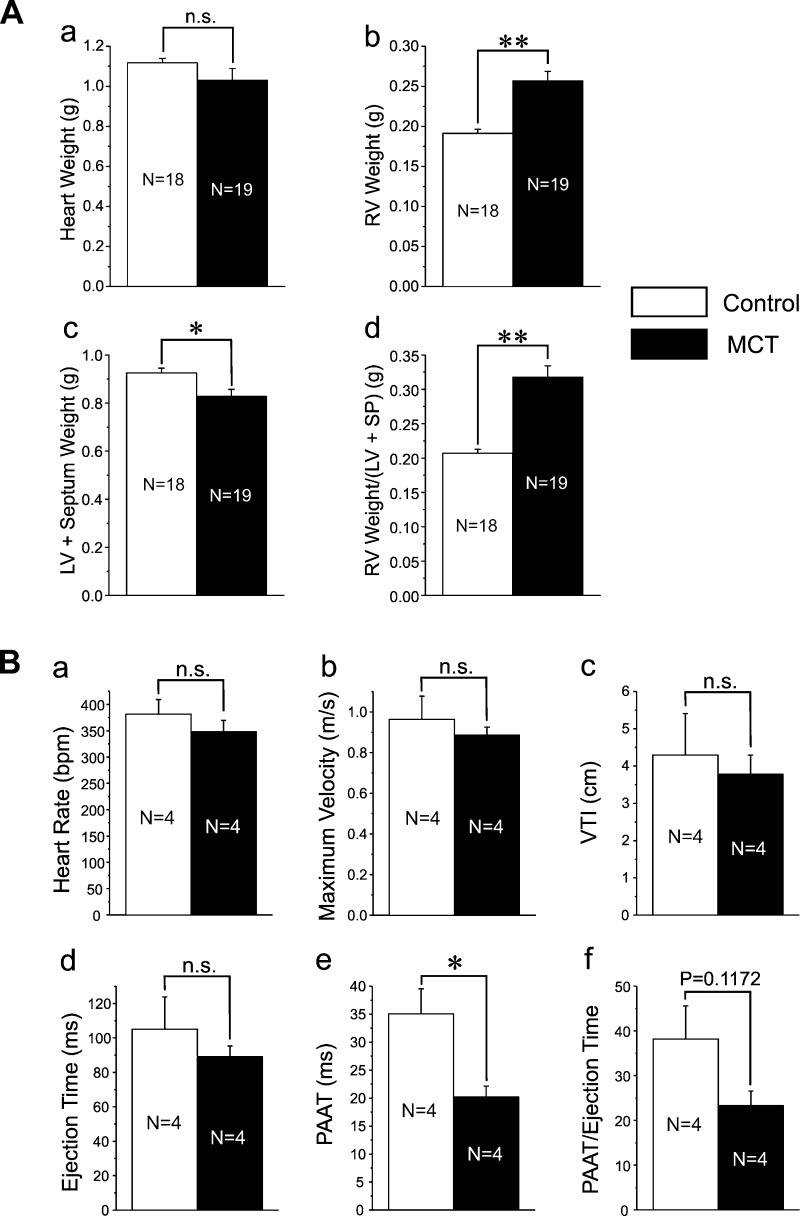
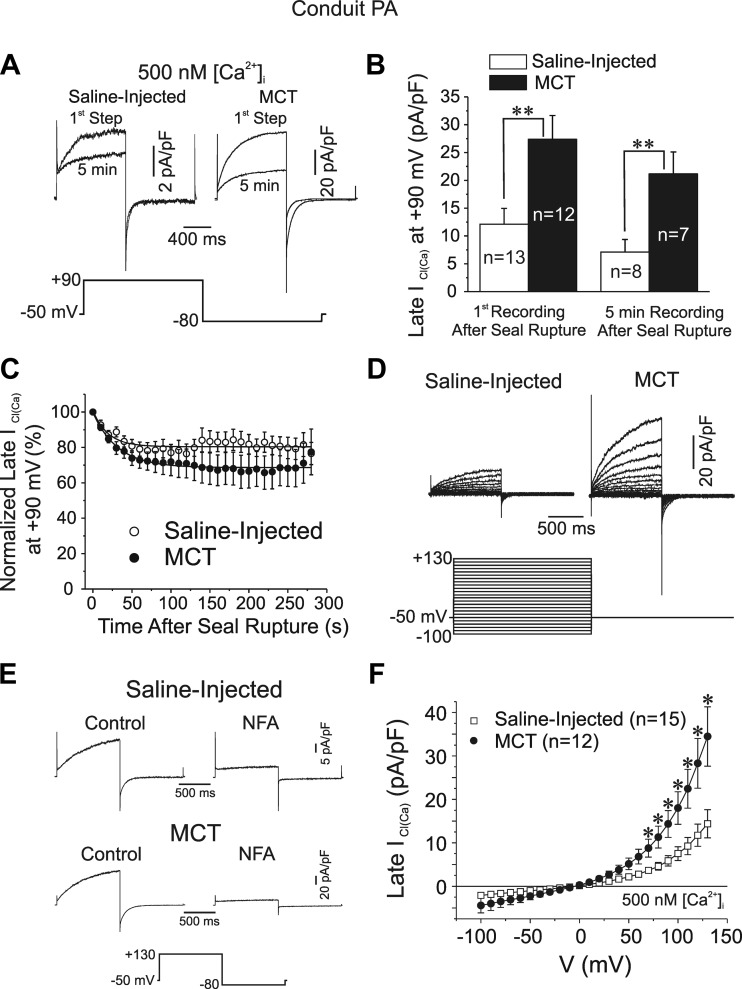
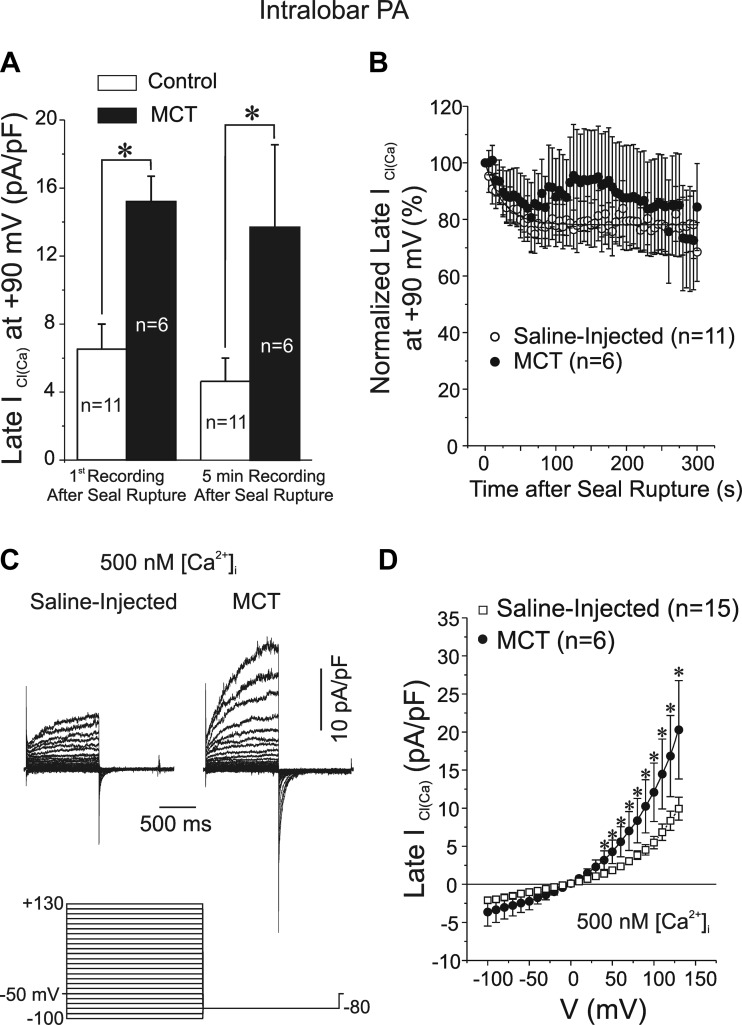
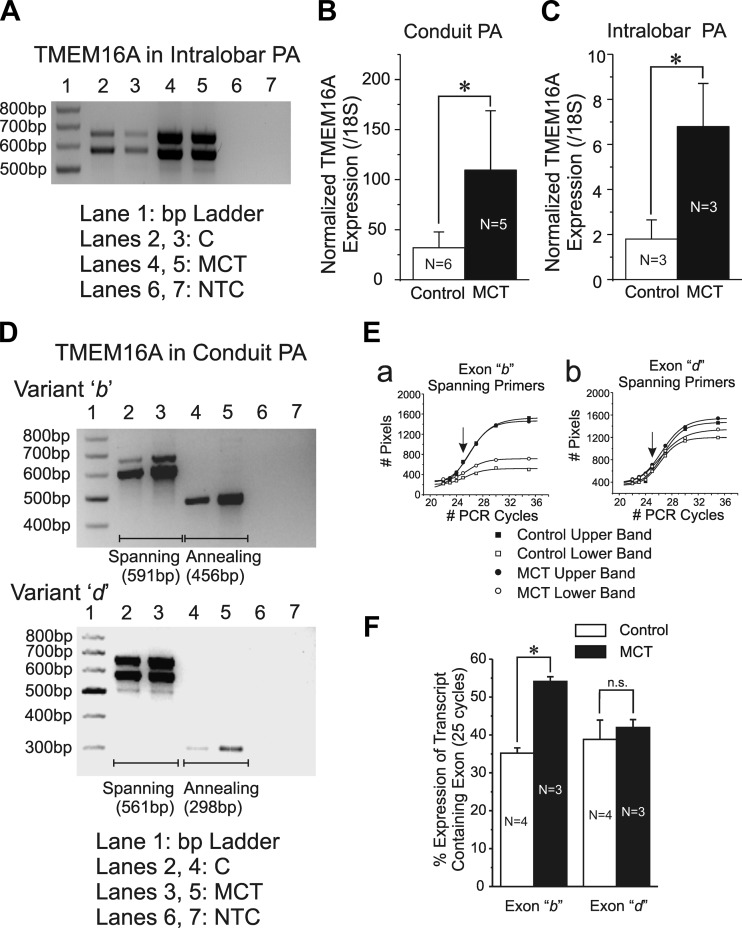
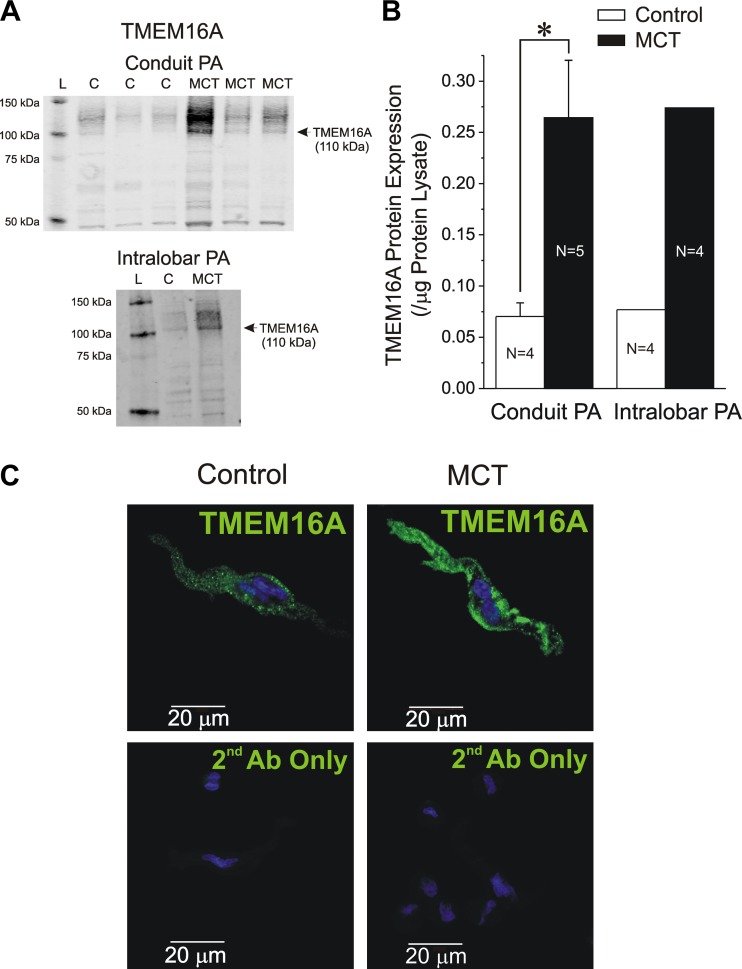
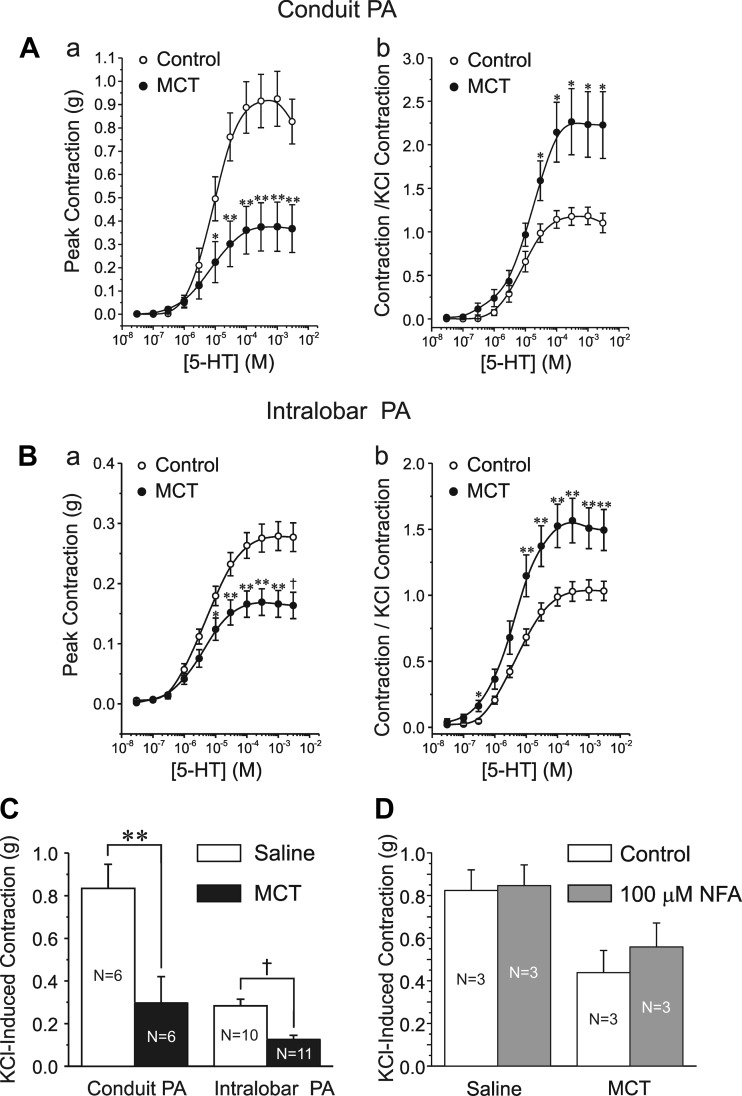
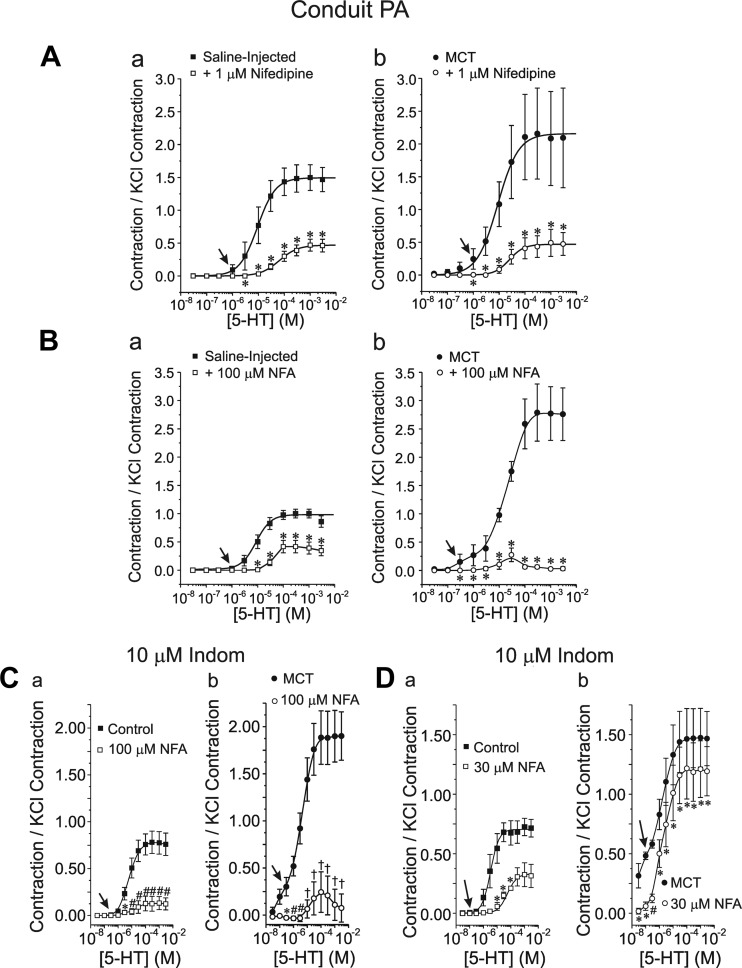
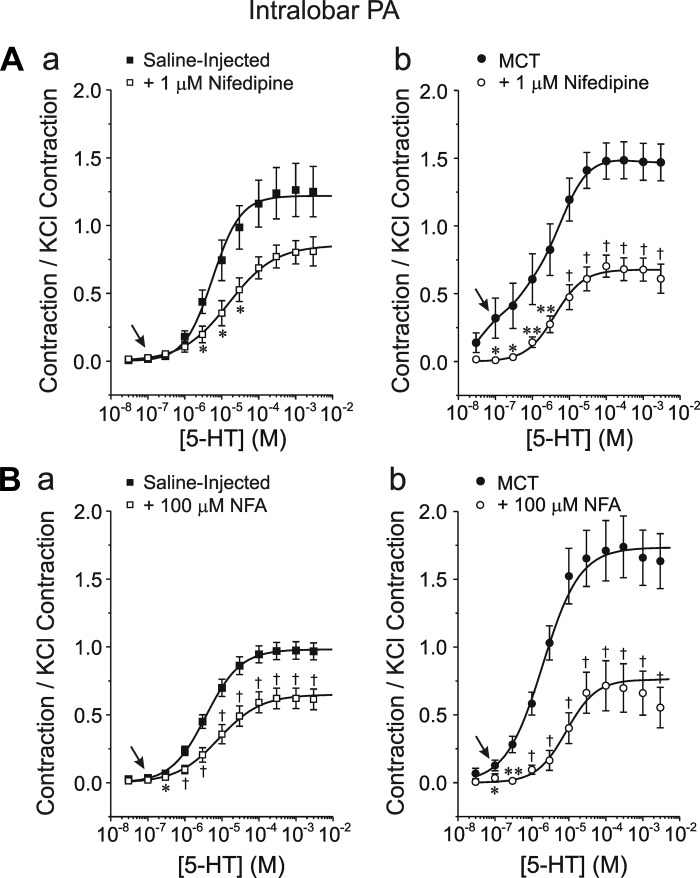
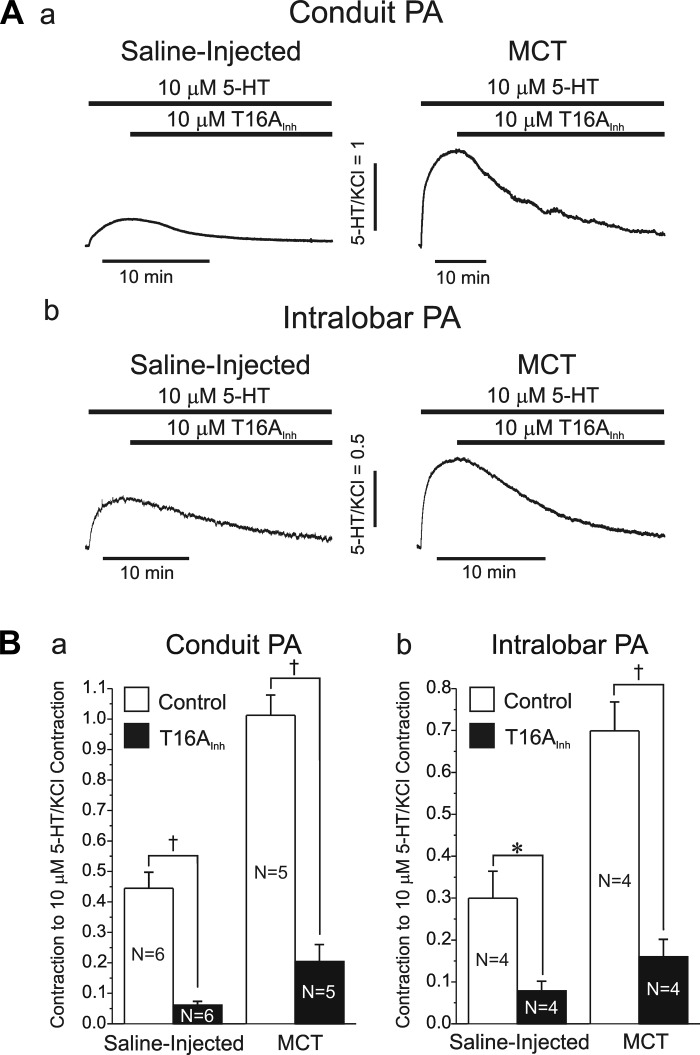
Pulmonary artery smooth muscle cells (PASMCs) are more depolarized and display higher Ca(2+) levels in pulmonary hypertension (PH). Whether the functional properties and expression of Ca(2+)-activated Cl- channels (Cl(Ca)), an important excitatory mechanism in PASMCs, are altered in PH is unknown. The potential role of Cl(Ca) channels in PH was investigated using the monocrotaline (MCT)-induced PH model in the rat. Three weeks postinjection with a single dose of MCT (50 mg/kg ip), the animals developed right ventricular hypertrophy (heart weight measurements) and changes in pulmonary arterial flow (pulse-waved Doppler imaging) that were consistent with increased pulmonary arterial pressure and PH. Whole cell patch experiments revealed an increase in niflumic acid (NFA)-sensitive Ca(2+)-activated Cl(-) current [I(Cl(Ca))] density in PASMCs from large conduit and small intralobar pulmonary arteries of MCT-treated rats vs. aged-matched saline-injected controls. Quantitative RT-PCR and Western blot analysis revealed that the alterations in I(Cl(Ca)) were accompanied by parallel changes in the expression of TMEM16A, a gene recently shown to encode for Cl(Ca) channels. The contraction to serotonin of conduit and intralobar pulmonary arteries from MCT-treated rats exhibited greater sensitivity to nifedipine (1 μM), an l-type Ca(2+) channel blocker, and NFA (30 or 100 μM, with or without 10 μM indomethacin to inhibit cyclooxygenases) or T16A(Inh)-A01 (10 μM), TMEM16A/Cl(Ca) channel inhibitors, than that of control animals. In conclusion, augmented Cl(Ca)/TMEM16A channel activity is a major contributor to the changes in electromechanical coupling of PA in this model of PH. TMEM16A-encoded channels may therefore represent a novel therapeutic target in this disease.


Figures

Fig. 1.
Fig. 1.
Evidence for right ventricular hypertrophy and changes in pulmonary arterial (PA) outflow in monocrotaline (MCT)-induced pulmonary hypertension. A: heart weight measurements performed 3 wk postinjection for 18 control saline-injected rats and 19 rats injected with 50 mg/kg MCT. Bar graphs report changes in total heart weight (Aa), right ventricular (RV) weight (Ab), combined left ventricular (LV) and interventricular septum (SP) weights (Ac), and ratio of RV weight/(LV + SP) weights (Ad). B: pulse-waved Doppler PA outflow analysis performed on saline-injected control and MCT-injected rats. Sample volume was placed (5 mm) proximal to the pulmonary valve leaflets and aligned to maximize laminar flow. For a-f, each bar represents means ± SE for a parameter measured from 4 animals in each group. Parameters measured were the heart rate (a) in beats per min (bpm), maximum velocity in m/s (b), velocity-time integral (VTI; c), ejection time (d), PA acceleration time (PAAT; e), and PAAT/ejection time ratio (f). N, number of animals; *P < 0.05; **P < 0.01; n.s., not significant.
Fig. 2.
Fig. 2.
Properties of Ca2+-activated Cl currents in smooth muscle cells of proximal conduit PA from MCT-treated rats. A: representative whole cell Ca2+-activated Cl current [ICl(Ca)] traces recorded from pulmonary artery smooth muscle cells (PASMCs) from a saline-injected control rat (top left) and a MCT-injected rat (top right). “1st Step” and “5 min” traces, respectively, refer to the very first current recorded immediately after measuring cell capacitance and that registered after 5 min of cell dialysis with a pipette solution containing 500 nM free Ca2+ concentration (500 nM [Ca2+]i). All traces were elicited by the voltage-clamp protocol shown below the traces. Note the different calibrations for the 2 sets of superimposed currents. B: effects of MCT treatment on mean ICl(Ca) amplitude measured at the end of 1-s pulses to +90 mV in PASMCs from saline (empty bars)- and MCT-injected (filled bars) rats soon after seal rupture (left bars) and after 5 min of cell dialysis (right bars). C: mean time course of changes of normalized late ICl(Ca) at +90 mV following cell rupture in PASMCs from saline (control; ○)- or MCT-injected (●) animals. All currents were normalized to the first current recorded at time = 0. Voltage-clamp protocol used to evoke ICl(Ca) was identical to that shown in B and was repeated every 5 s. The 2 lines are least-squares exponential fits to the mean data. The 2 time courses were not statistically different from one another. Control: n = 13; MCT: n = 12. D: representative families of Ca2+-activated Cl currents recorded with a pipette solution containing 500 nM Ca2+ in freshly dispersed PASMCs from proximal conduit arteries from a saline-injected rat (left traces) and a rat injected with MCT (right traces) to induce pulmonary hypertension. All currents were evoked by the voltage-clamp protocol shown below the traces. E: sample traces from 2 representative experiments showing the potent inhibition of ICl(Ca) by 100 μM niflumic acid (NFA; ∼5 min) in PASMCs dialyzed with 500 nM Ca2+ from a saline (top)- and a MCT-injected (bottom) rat. Currents were evoked by the protocol shown below the traces. F: mean current-voltage relationships for ICl(Ca) recorded in PASMCs from saline-injected controls and MCT-treated rats. ICl(Ca) was measured at the end of 1-s steps to voltages ranging from −100 to +130 mV from holding potential of −50 mV (protocol identical to that in A). For B and F, n = number of cells; *P < 0.05 and **P < 0.001, statistically significant.
Fig. 3.
Fig. 3.
Properties of Ca2+-activated Cl currents in smooth muscle cells of intralobar PAs from MCT-treated rats. A: effects of MCT treatment on mean ICl(Ca) amplitude measured at the end of 1-s pulses to +90 mV in PASMCs from saline (control; empty bars)- and MCT-injected (filled bars) rats soon after seal rupture (left bars) and after 5 min of cell dialysis (right bars). B: mean time course of changes of normalized late ICl(Ca) at +90 mV following cell rupture in PASMCs from saline (control; ○)- or MCT-injected (●) animals. All currents were normalized to the first current recorded at time = 0. Voltage-clamp protocol used to evoke ICl(Ca) was identical to that shown in Fig. 2A and was repeated every 5 s. The 2 time courses were not statistically different from one another. C: representative families of Ca2+-activated Cl currents recorded with a pipette solution containing 500 nM free Ca2+ in freshly dispersed PASMCs from intralobar pulmonary arteries from a saline-injected rat (left traces) and a rat injected with MCT (right traces) to induce pulmonary hypertension. All currents were evoked by the voltage-clamp protocol shown below the traces. D: mean current-voltage relationships for ICl(Ca) recorded in PASMCs isolated from intralobar PA of saline-injected controls and MCT-treated rats. ICl(Ca) was measured at the end of 1-s steps to voltages ranging from −100 to +130 mV from holding potential of −50 mV (protocol identical to that in C). For A, B, and D, n = number of cells; *P < 0.05.
Fig. 4.
Fig. 4.
Changes in TMEM16A mRNA expression of conduit and intralobar pulmonary arteries in MCT-induced pulmonary hypertension. A: semiquantitative RT-PCR experiment showing increased expression of TMEM16A mRNA in a pulmonary artery from 2 MCT-treated rats vs. that from 2 aged-matched saline-injected controls (C) as labeled. Notice the presence of 2 bands in each lane consistent with the predicted rat TMEM16A including or excluding spliced variant d (Table 1). NTC, nontemplate control. B and C: quantitative RT-PCR for TMEM16A mRNA transcript expression relative to the ribosomal housekeeping gene 18S in conduit and intralobar PA, respectively, from control saline-injected (empty bars) and MCT-treated (filled bars) animals. D: sample agarose gels highlighting mRNA expression of spliced variants b (top) and d (bottom) of TMEM16A in pulmonary arteries from a saline-injected control and a MCT-treated animal (MCT). Each spliced variant was interrogated with 2 different sets of primers (Table 1), 1 spanning the alternatively spliced exon (lanes 2 and 3) and 1 in which 1 of the 2 primers was designed to anneal to the target exon (lanes 4 and 5). Primers sets spanning or annealing to the target exon resulted in a double or a single band, respectively, with the predicted number of base pairs (bp) indicated below each gel. E: graphs showing the effect of PCR cycle number on the amplification of TMEM16A transcripts of pulmonary arteries from a saline-injected control (■, ☐) and a MCT-injected rat (●, ○). Amplified cDNA transcripts either contained (top band; ■, ●) or excluded (bottom band; ☐, ○) the alternatively spliced exon for variants b (a) and d (b). These experiments served to determine the optimal PCR cycle number allowing for a more accurate determination of the relative expression of the alternatively spliced exons. The 25 PCR cycles were subsequently used for this analysis (arrows in a and b) as it lied in the ascending linear portion of amplification for both spliced exons. All smooth lines passing through the data points are least squares Boltzmann fits. F: mean relative percent expression after 25 cycles of PCR of alternatively spliced exons b (left bars) and d (right bars) pooled from pulmonary arterial samples from saline-injected control (open bars) and MCT-treated rats (filled bars). N = number of animals; *P < 0.05; n.s.: not significant.
Fig. 5.
Fig. 5.
TMEM16A protein is upregulated in conduit and intralobar pulmonary arteries from MCT-induced pulmonary hypertensive rats. A: Western blot analysis of TMEM16A protein expression in conduit (top gel) and intralobar (bottom gel) PA from saline-injected control and MCT-treated rats. Top gel: immunoblots from 3 control and 3 MCT pulmonary arteries; bottom gel: generated by pooling intralobar PA from 4 saline-injected (C) and 4 MCT-injected rats. All blots were probed with a custom-generated rabbit polyclonal antibody raised against 3 epitopes found in mouse and rat TMEM16A protein as described in materials and methods. For both gels, a major band at ∼110 kDa and more diffuse higher molecular mass bands displayed significantly higher levels in the MCT vs. C lane. The C and MCT lanes were each loaded with 20 μg of lysate protein. L, molecular mass ladder. B: pooled Western blot densitometry measurements for TMEM16A expression in conduit (left bars) and intralobar PA (right bars) from control (open bars) and MCT-treated rats (closed bars). For intralobar PA, total protein lysates from four animals in each group were combined for analysis. N = number of animals. *P < 0.05. C: immunocytochemical detection of TMEM16A protein (green; Abcam 53213 antibody) in freshly isolated PASMCs from control and MCT-treated rats (top images as labeled). Bottom images: lack of TMEM16A staining when the cells were exposed to secondary antibody only (2nd Ab Only). For all images, nuclei appear in blue and were stained with bisbenzamide.
Fig. 6.
Fig. 6.
Changes in the contractile phenotype of rat pulmonary arteries induced by MCT. A and B: mean cumulative dose-response curves to serotonin (5-HT) of the contraction of conduit and intralobar PA, respectively, from saline-injected control (○) and MCT-injected (●) rats. For A and B, a plots the magnitude of the absolute peak contraction relative to baseline, whereas b plots the same data normalized to the maximal KCl (80 mM)-induced contraction. A: 6 animals per group, 2 rings per animal; B: control, 10 animals (2 rings per animal); MCT, 11 animals (2 rings per animal). C: bar graph showing the mean changes in the KCl-induced contraction of conduit (left bars) and intralobar (right bars) PA from control (black) and MCT-treated (red) rats. D: bar graph showing the effects of NFA (white bars) on the peak contraction evoked by 80 mM KCl in conduit pulmonary arteries derived from saline-injected (left bars) or MCT-injected rats. For C and D, N = number of animals (2 rings per animal). For A-D, *P < 0.05; **P < 0.01; P < 0.001.
Fig. 7.
Fig. 7.
Altered sensitivity of the 5-HT-induced contraction of conduit PA to L-type Ca2+ channel and ClCa inhibitors in MCT-induced PH. A: effects of 1 μM nifedipine on the dose-response relationships of the PA contraction to 5-HT normalized to the KCl-induced contraction in saline-injected control (a) and MCT-treated (b) rats; ☐, ■ and ○, ● in a and b represent data obtained in the absence and presence of the drug, respectively. B: nomenclature identical to A except that these experiments tested the effects of 100 μM NFA in the 2 groups of animals. C: nomenclature identical to A except that these experiments tested the effects of 100 μM NFA in the presence of 10 μM indomethacin (Indom) in the 2 groups of animals. D: nomenclature identical to A except that these experiments tested the effects of 30 μM NFA in the presence of 10 μM indomethacin in the 2 groups of animals. For AD, arrows highlight the appearance of significant contractions in MCT-injected animals at low 5-HT concentrations relative to their control counterpart. For AD, data were collected from 6 rings, 2 from each of 3 animals. For AD, *P < 0.05; #P < 0.01; P < 0.001.
Fig. 8.
Fig. 8.
Altered sensitivity of the 5-HT-induced contraction of intralobar PA to L-type Ca2+ channel and ClCa inhibitors in MCT-induced PH. Nomenclature is identical to that of Fig. 7, A and 7B. Aa: six rings, 3 animals; Ab: 14 rings, 7 animals. Ba: 10 rings, 5 animals; Bb: 14 rings, 8 animals. Arrows highlight the appearance of significant contractions in MCT-injected animals at low 5-HT concentrations relative to their control counterpart. For all A and B, *P < 0.05; **P < 0.01; P < 0.001.
Fig. 9.
Fig. 9.
Altered sensitivity of the 5-HT-induced contraction of conduit and intralobar pulmonary arteries to the specific ClCa/TMEM16A inhibitor T16AInh-A01 in MCT-induced PH. A: typical isometric force recordings illustrating the vasorelaxation mediated by the specific TMEM16A inhibitor T16Inh-A01 (T16AInh, bottom thick bar) on the contraction of conduit (a) and intralobar (b) pulmonary arterial rings evoked by 10 μM 5-HT (top thick bar) from saline-injected control (left trace) and MCT-treated (right trace) rats. All contractions were normalized to that elicited by 80 mM KCl (vertical calibrations). B: bar graphs summarizing pooled data from similar experiments to those shown in A. Each bar represents the means ± SE contraction to 5-HT normalized to the KCl-induced contraction in each PA ring; a and b: reflect data obtained in conduit and intralobar PA rings, respectively, as indicated. For a and b, *P < 0.05 and P < 0.001. Please note that for a and b, the contraction evoked by 5-HT of PA rings from MCT rats was significantly higher than that of control animals. However, the level tone of PA rings from MCT rats remaining in the presence of T16AInh-A01 and 5-HT was not significantly different than that measured in PA rings from saline-injected control rats. For A and B, N = number of animals.

References

    1. Altiere RJ, Olson JW, Gillespie MN. Altered pulmonary vascular smooth muscle responsiveness in monocrotaline-induced pulmonary hypertension. J Pharmacol Exp Ther 236: 390–395, 1986 - PubMed
    1. Angermann JE, Forrest AS, Greenwood IA, Leblanc N. Activation of Ca2+-activated Cl− channels by store-operated Ca2+ entry in arterial smooth muscle cells does not require reverse-mode Na+/Ca2+ exchange. Can J Physiol Pharmacol 90: 903–921, 2012 - PubMed
    1. Angermann JE, Sanguinetti AR, Kenyon JL, Leblanc N, Greenwood IA. Mechanism of the inhibition of Ca2+-activated Cl− currents by phosphorylation in pulmonary arterial smooth muscle cells. J Gen Physiol 128: 73–87, 2006 - PMC - PubMed
    1. Archer SL, Weir EK, Wilkins MR. Basic science of pulmonary arterial hypertension for clinicians: new concepts and experimental therapies. Circulation 121: 2045–2066, 2010 - PMC - PubMed
    1. Ayon R, Sones W, Forrest AS, Wiwchar M, Valencik ML, Sanguinetti AR, Perrino BA, Greenwood IA, Leblanc N. Complex phosphatase regulation of Ca2+-activated Cl− currents in pulmonary arterial smooth muscle cells. J Biol Chem 284: 32507–32521, 2009 - PMC - PubMed

Publication types

MeSH terms