. 2013 Jan;23(1):34-45.
doi: 10.1101/gr.140269.112. Epub 2012 Oct 3.

Birth and expression evolution of mammalian microRNA genes

Affiliations

Birth and expression evolution of mammalian microRNA genes

Julien Meunier et al. Genome Res. 2013 Jan.

Abstract

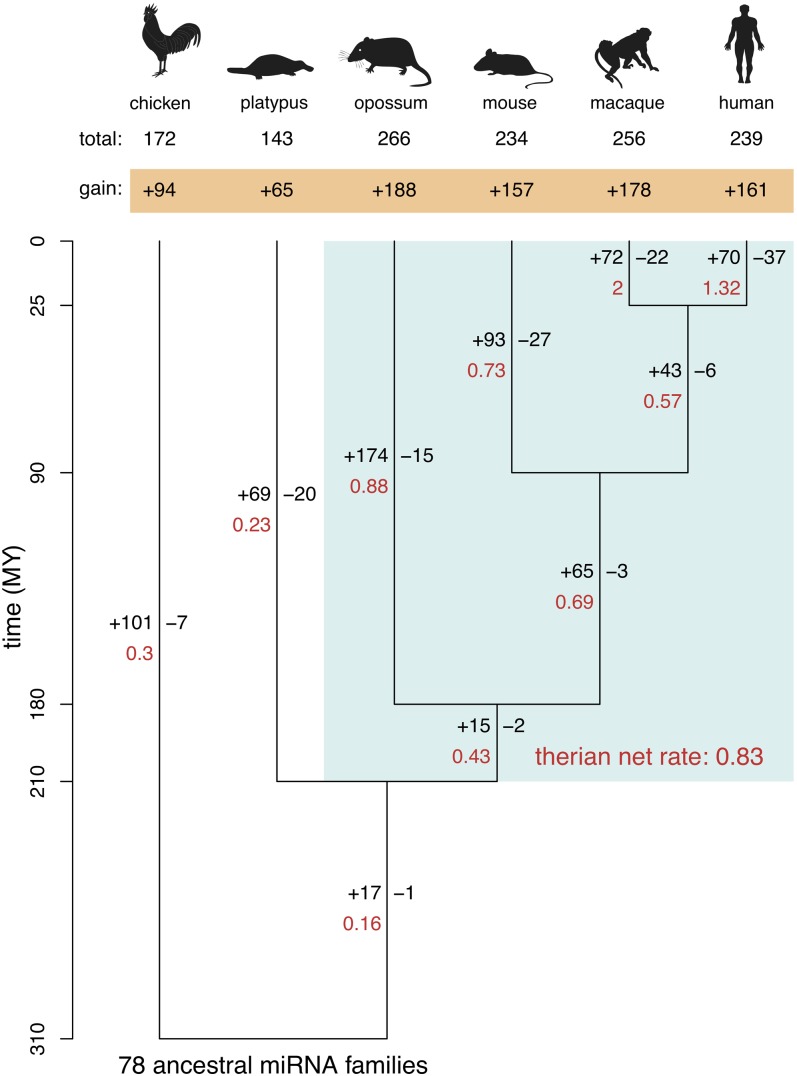
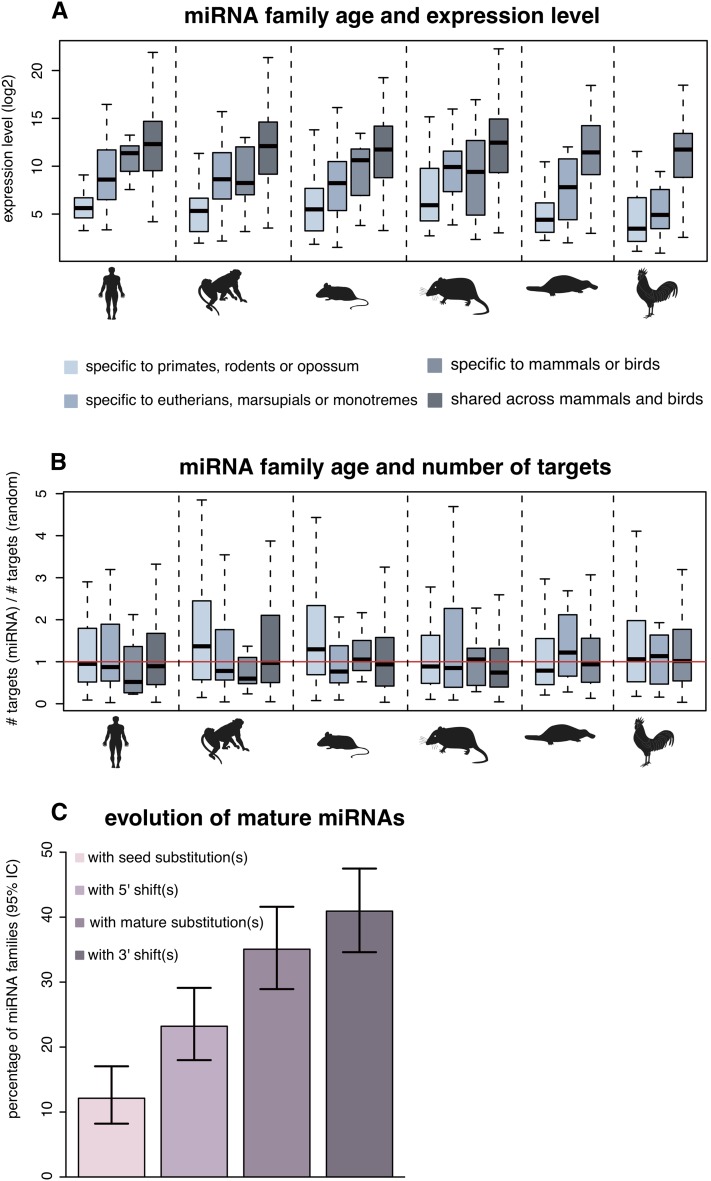
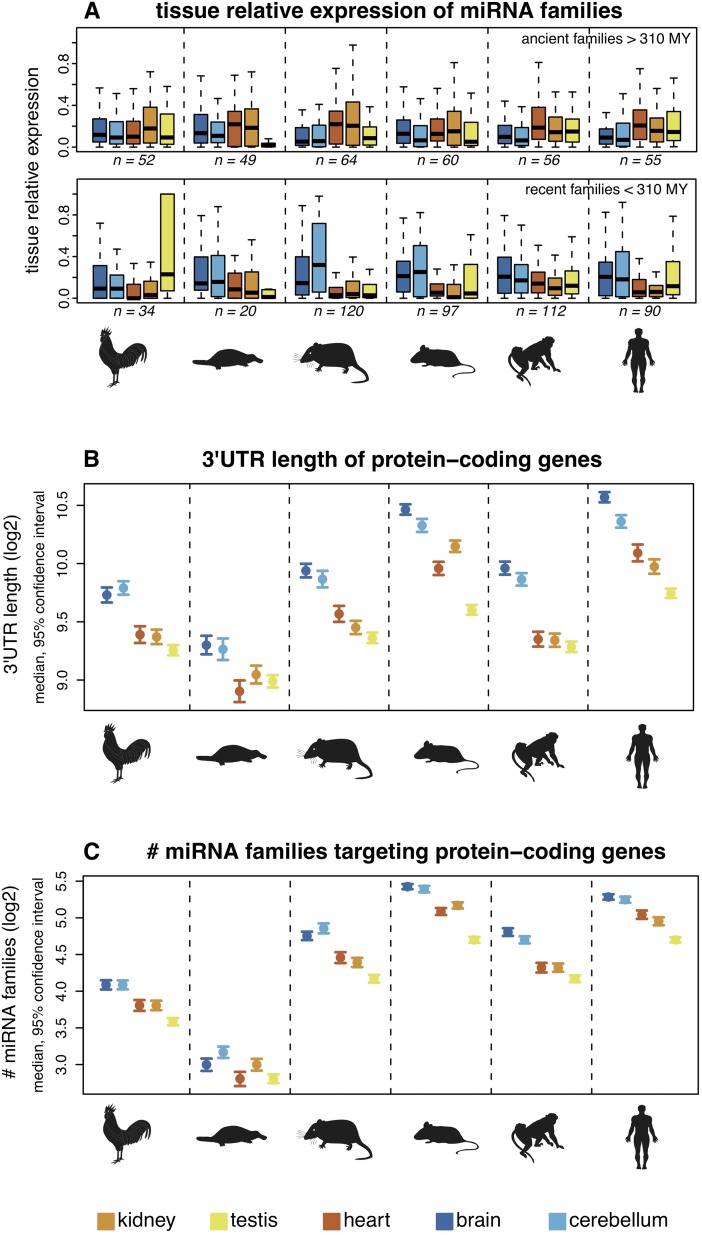
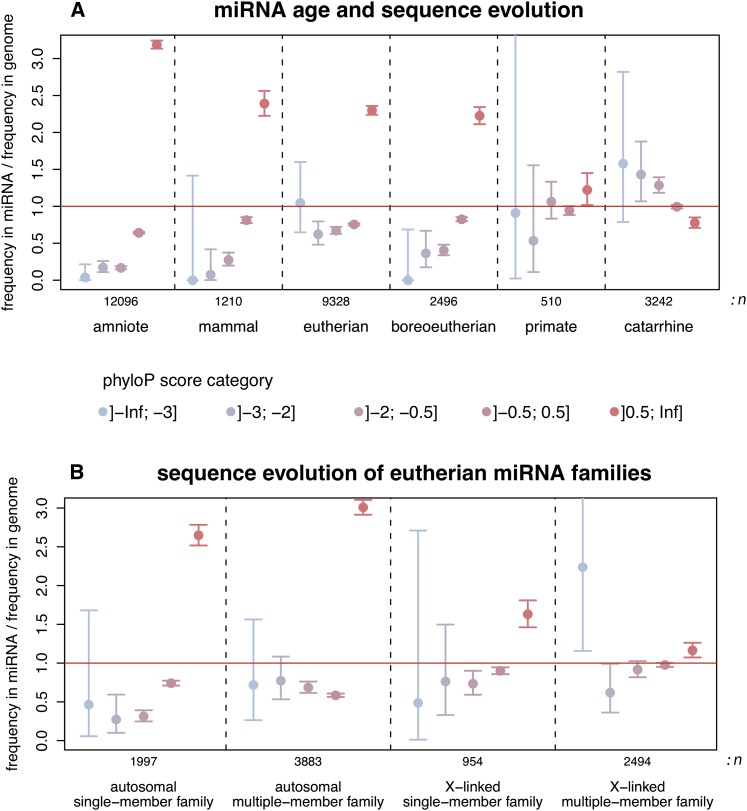
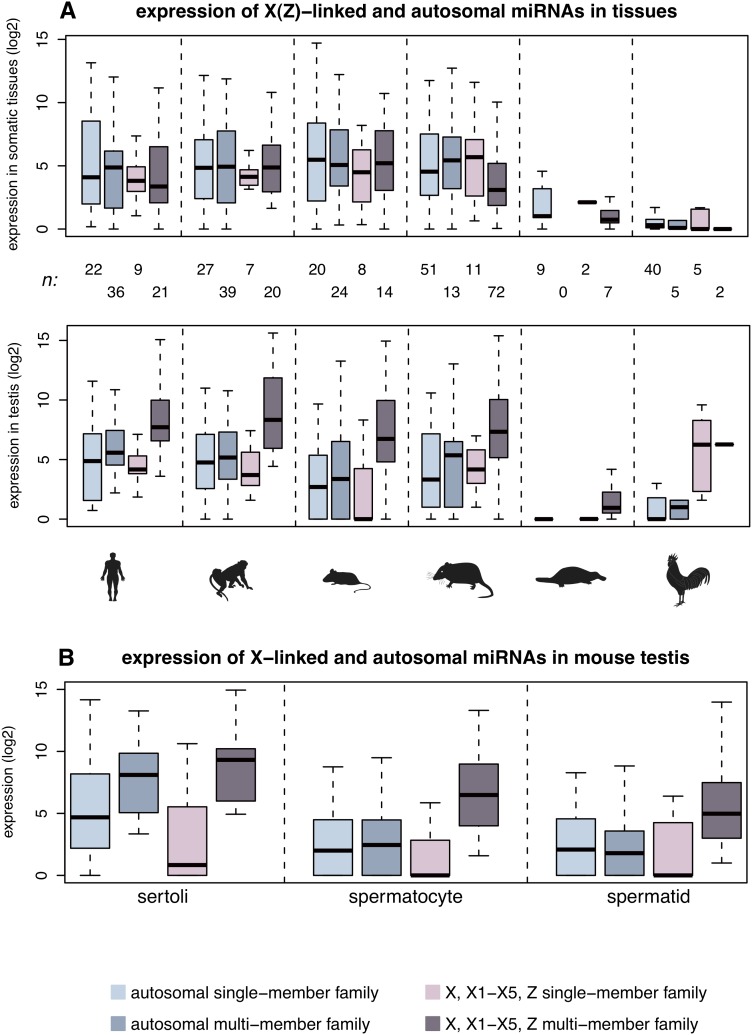
MicroRNAs (miRNAs) are major post-transcriptional regulators of gene expression, yet their origins and functional evolution in mammals remain little understood due to the lack of appropriate comparative data. Using RNA sequencing, we have generated extensive and comparable miRNA data for five organs in six species that represent all main mammalian lineages and birds (the evolutionary outgroup) with the aim to unravel the evolution of mammalian miRNAs. Our analyses reveal an overall expansion of miRNA repertoires in mammals, with threefold accelerated birth rates of miRNA families in placentals and marsupials, facilitated by the de novo emergence of miRNAs in host gene introns. Generally, our analyses suggest a high rate of miRNA family turnover in mammals with many newly emerged miRNA families being lost soon after their formation. Selectively preserved mammalian miRNA families gradually evolved higher expression levels, as well as altered mature sequences and target gene repertoires, and were apparently mainly recruited to exert regulatory functions in nervous tissues. However, miRNAs that originated on the X chromosome evolved high expression levels and potentially diverse functions during spermatogenesis, including meiosis, through selectively driven duplication-divergence processes. Overall, our study thus provides detailed insights into the birth and evolution of mammalian miRNA genes and the associated selective forces.


Figures

Figure 1.
Figure 1.
Birth and death rates of miRNA families. Phylogeny of the six studied amniote species and estimated rates of miRNA family gain and loss, as inferred by a maximum likelihood procedure (Methods), are shown. Note that the estimated number of families in the amniote ancestor that have been completely lost during evolution (i.e., with no representative in extant species) is zero. Branch lengths reflect evolutionary divergence times in million of years (MY). Number of gained (+) and lost (–) families (in black) as well as the net gain rate of miRNA families per MY (in red) are indicated next to each branch. The therian net gain rate was computed based on the gain and loss of miRNA families across the entire therian clade (light blue box). The net number of families that have been gained since the bird-mammal split are indicated in the orange box, and the total number of families for each species are indicated above.
Figure 2.
Figure 2.
Age of miRNA families relative to their expression levels and numbers of predicted target genes. (A) Expression level distributions of miRNA families of different ages. Expression values for each miRNA family were computed as the median expression levels of all family members across all tissues. Also, common expression values associated with two or more miRNA loci with highly similar mature sequences were divided by the number of loci involved. Age categories of miRNA families are represented from the most recent (far left) to the most ancient (far right) for each species based on their phylogenetic distribution (see Methods). (B) Number of predicted target genes of miRNA families of different ages divided by the number of predicted targets for mock miRNAs from random intronic sequences (Methods) using PITA. Number of target genes per miRNA family was computed as the median number of targets of all family members. (C) Evolution of mature miRNA sequences. The percentage of miRNA families displaying one or more modifications in the mature sequence (substitutions in the seed or in the rest of the mature sequence; shifts in the 5′ or 3′ end of the mature miRNA) is shown together with 95% confidence intervals.
Figure 3.
Figure 3.
Spatial expression patterns of miRNAs and 3′-UTR structures of predicted target genes. (A) Age of miRNA families and their relative expression by tissues. Relative expression values for each family were calculated as the sum of expression values of all family members in a given tissue divided by their total expression across all tissues. Colored symbols indicate the median relative expression value of miRNA families. Ancient/recent families: families that originated before/after the mammal-bird split. Samples sizes (n) are indicated (note that miRNA families with low expression levels were filtered out in this analysis; see Methods for details). For all but the ancient macaque and recent platypus families, the difference between the maximum and minimum median values is significantly higher than expected by chance (permutation test on tissue labels, corrected P < 0.05). (B) 3′-UTR lengths of protein-coding genes. Protein-coding genes were classified according to the tissue in which they are most highly expressed. (C) Numbers of miRNA families targeting protein-coding genes (using PITA predictions). A miRNA family was considered to target a gene if one or more of the miRNAs were predicted to target the gene's 3′ UTR. Patterns are shown for all miRNA families. Notably, similar results are obtained for ancient and recent families when these are analyzed separately and using TargetScan target predictions (Supplemental Fig. S15).
Figure 4.
Figure 4.
Evolution of miRNA precursor sequences. (A) Comparisons of phyloP score category frequencies between human miRNA precursor sequences and the genomic background. miRNA/genome frequency ratios >1 indicate a higher frequency of sites with a given phyloP score category in miRNAs relative to the genomic background (and vice versa). Primate-based phyloP scores: rapidly evolving sites (score < −0.5); slowly evolving sites (score > 0.5). Error bars: 95% confidence intervals. The age (i.e., phylogenetic distribution; Methods) of miRNAs and the total number of miRNA sites considered (n) are indicated at the bottom of the panel. (B) Sequence evolution of miRNA families on the X chromosome and autosomes. To limit biases due to age variations, only eutherian-specific miRNA families predating the human-mouse split were considered.
Figure 5.
Figure 5.
Expression patterns of sex chromosome-linked and autosomal miRNAs. (A) Spatial expression pattern of miRNA genes on the therian X, platypus X1–X5, and bird Z chromosomes. Expression level distributions of miRNA genes shared among and specific to eutherians, marsupials, monotremes, or specific to chicken (see Methods for miRNA age definitions) are shown. The sample size, n, corresponds to the number of independent expression values. Note that we define expression levels of miRNA genes in somatic tissues as their median expression levels across all four somatic tissues. Also, common expression values associated with two or more miRNA loci with highly similar mature sequences were divided by the number of loci involved. (B) Expression of miRNA genes shared among and specific to eutherians in mouse spermatogenic cells. Sample sizes are the same as indicated for mouse in panel A.

References

    1. Altschul SF, Gish W, Miller W, Myers EW, Lipman DJ 1990. Basic local alignment search tool. J Mol Biol 215: 403–410 - PubMed
    1. Bartel DP 2009. MicroRNAs: Target recognition and regulatory functions. Cell 136: 215–233 - PMC - PubMed
    1. Benjamini Y, Hochberg Y 1995. Controlling the false discovery rate: A practical and powerful approach to multiple testing. JR Stat Soc 57: 289–300
    1. Berezikov E 2011. Evolution of microRNA diversity and regulation in animals. Nat Rev Genet 12: 846–860 - PubMed
    1. Bernhart SH, Tafer H, Mückstein U, Flamm C, Stadler PF, Hofacker IL 2006. Partition function and base pairing probabilities of RNA heterodimers. Algorithms Mol Biol 1: 3 doi: 10.1186/1748-7188-1-3 - PMC - PubMed

Publication types

Associated data