. 2012 Oct 3;32(40):13644-60.
doi: 10.1523/JNEUROSCI.2581-12.2012.

Influence of highly distinctive structural properties on the excitability of pyramidal neurons in monkey visual and prefrontal cortices

Affiliations

Influence of highly distinctive structural properties on the excitability of pyramidal neurons in monkey visual and prefrontal cortices

Joseph M Amatrudo et al. J Neurosci. .

Abstract

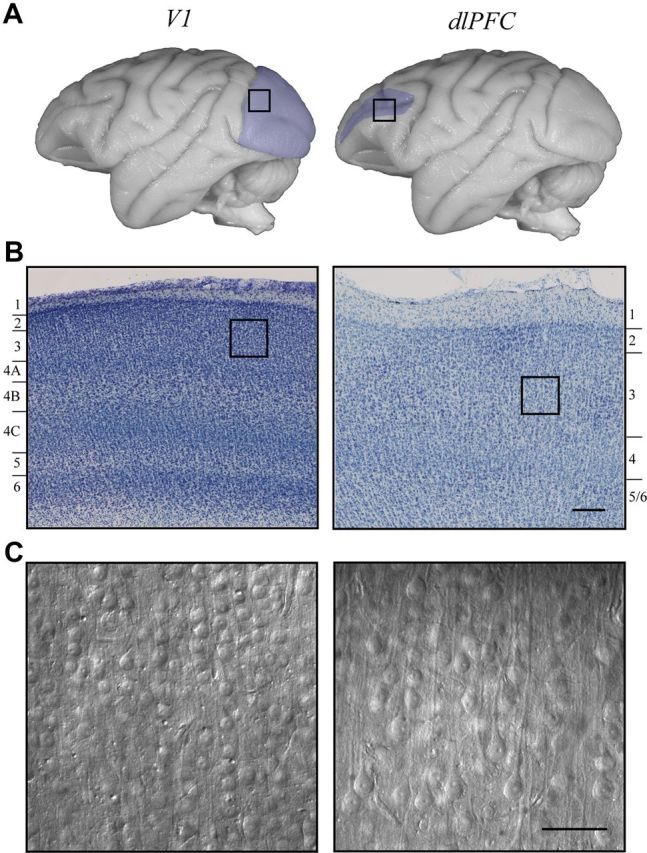
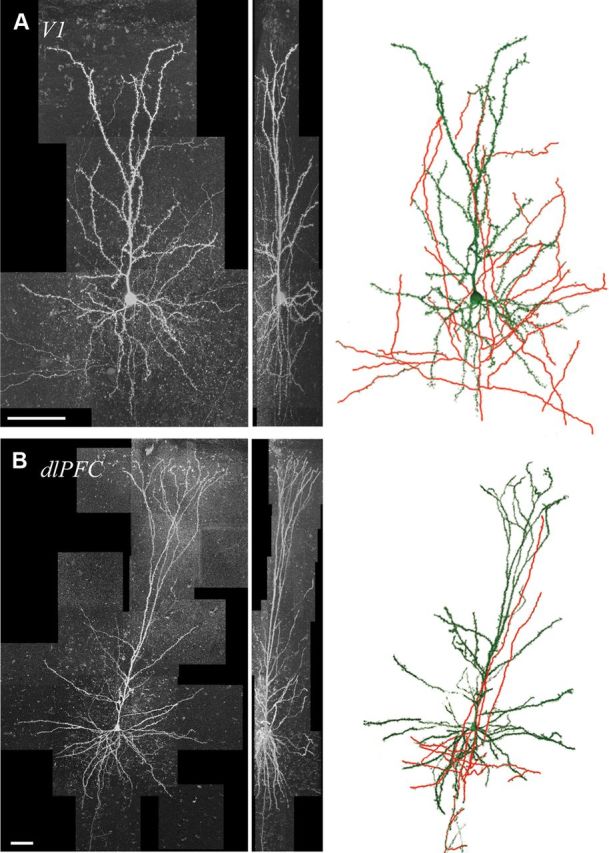
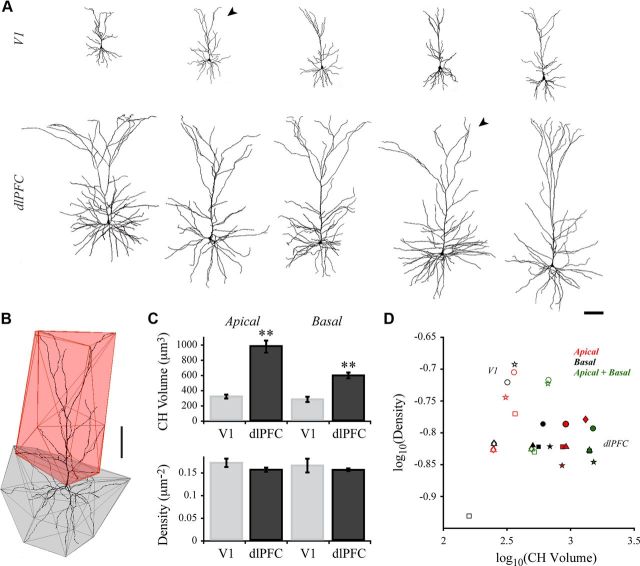
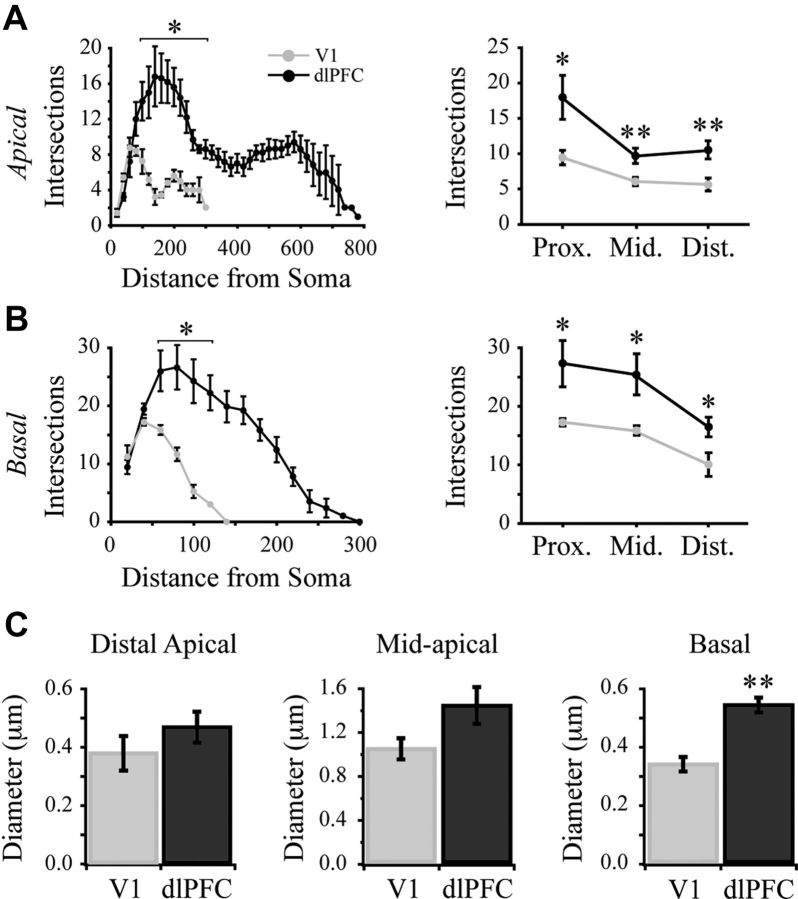
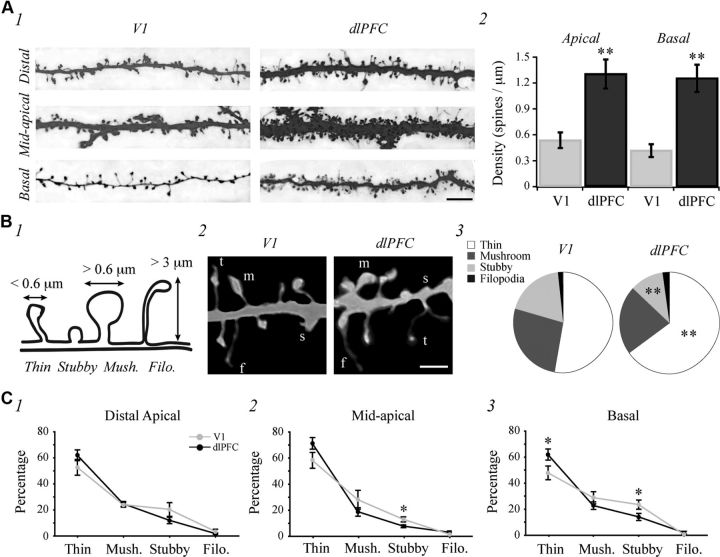
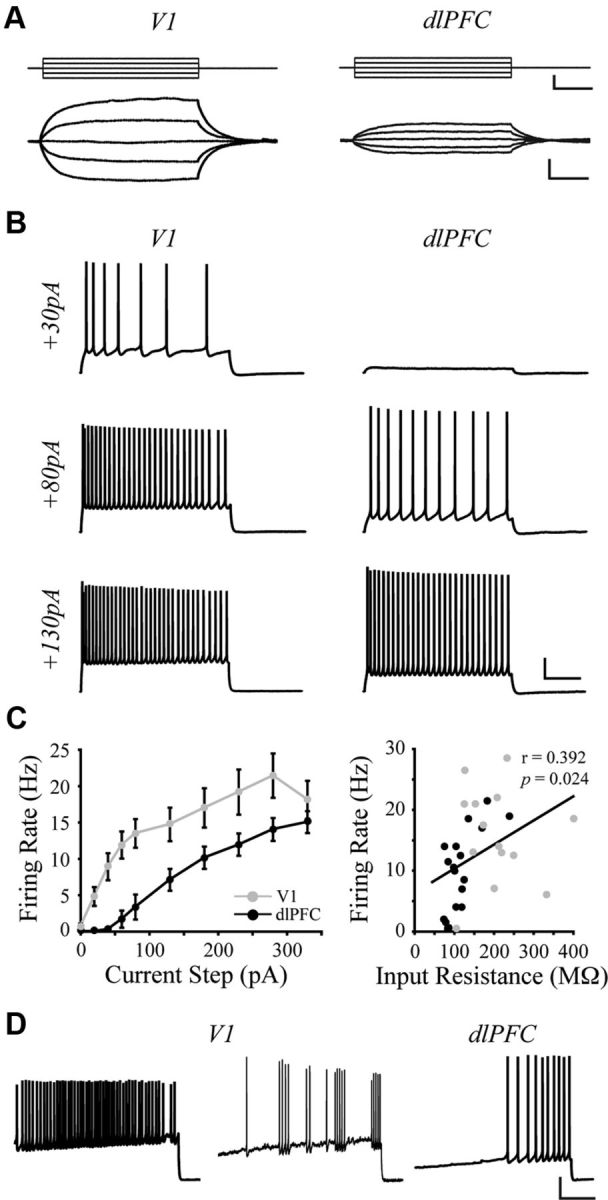
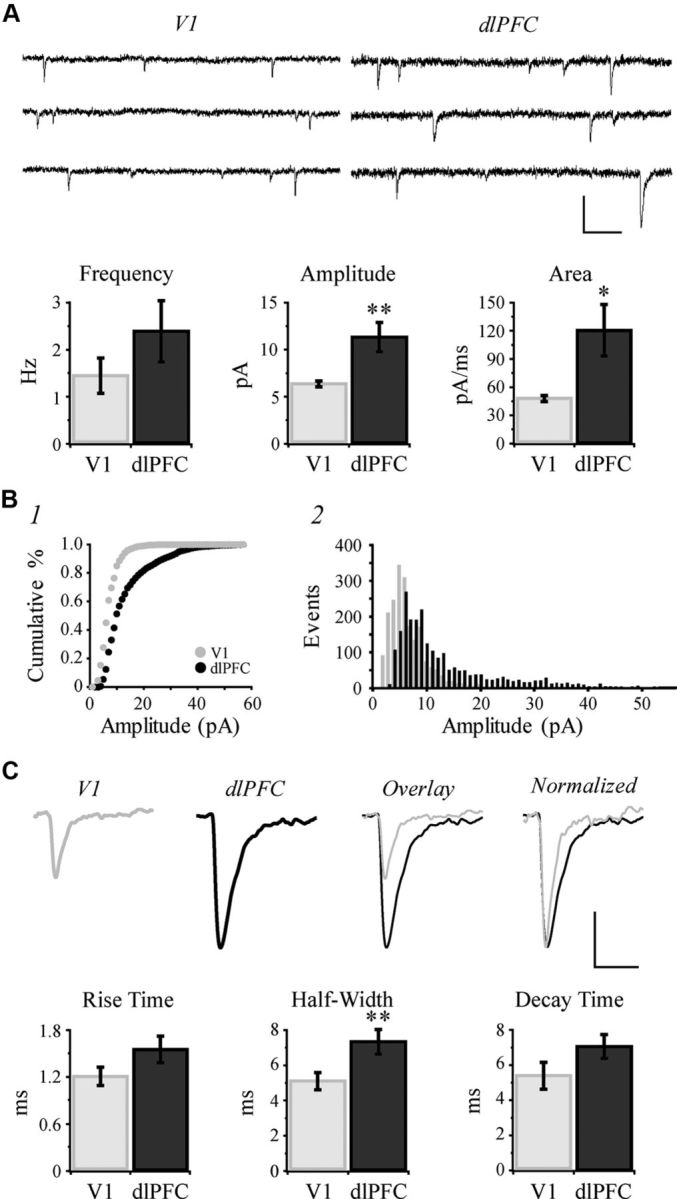
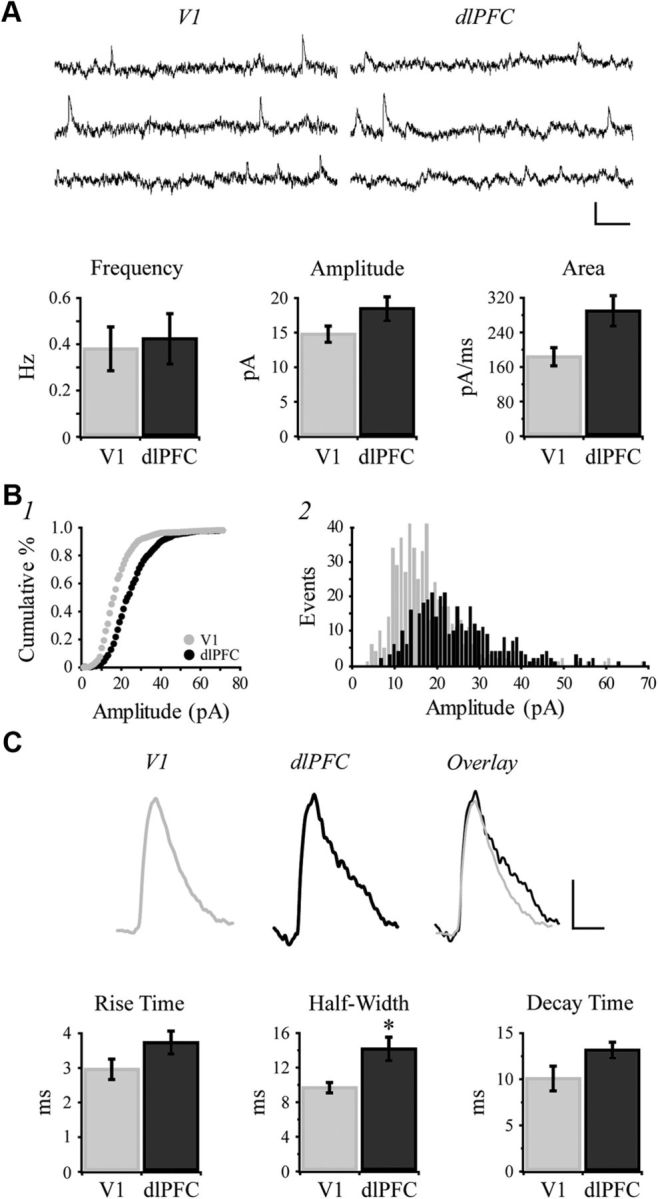
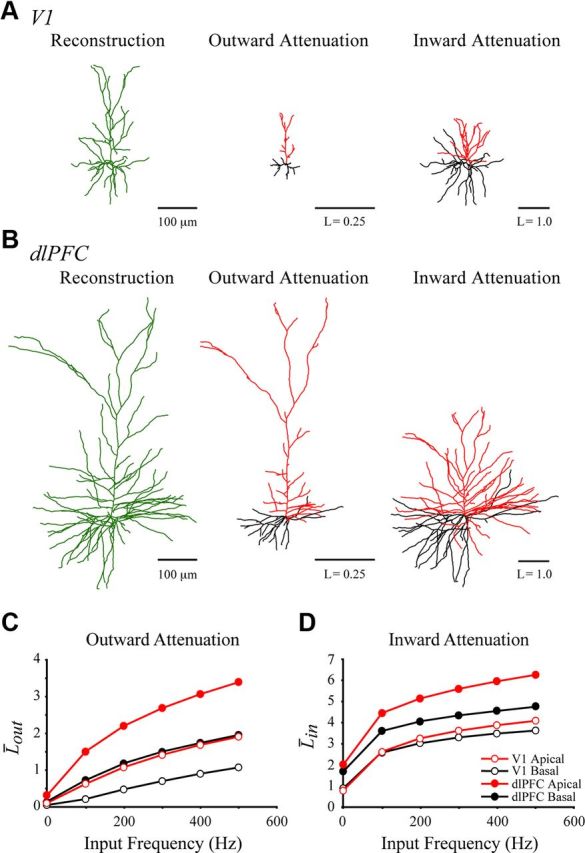
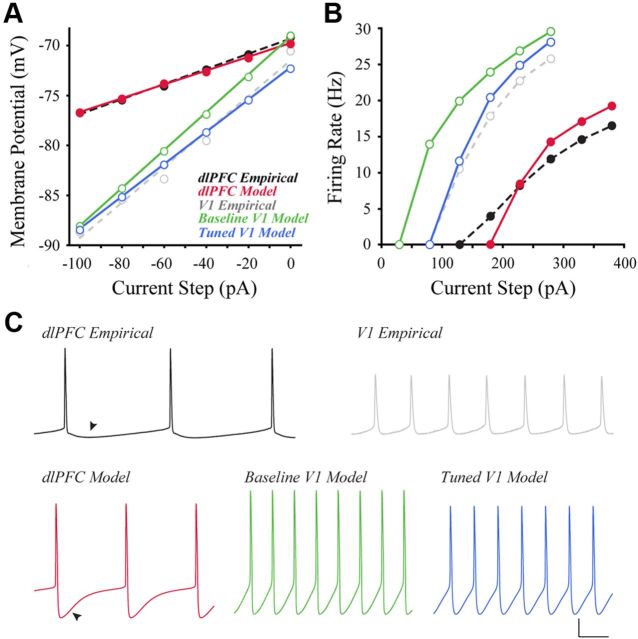
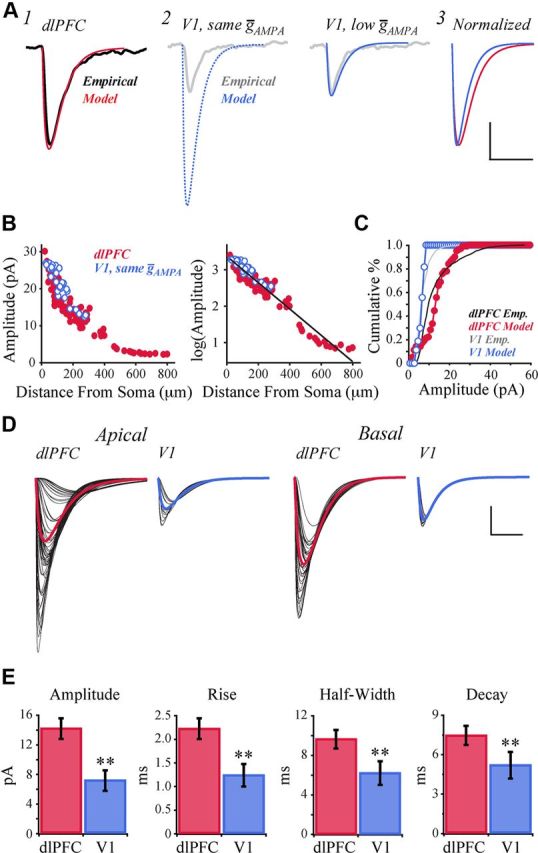
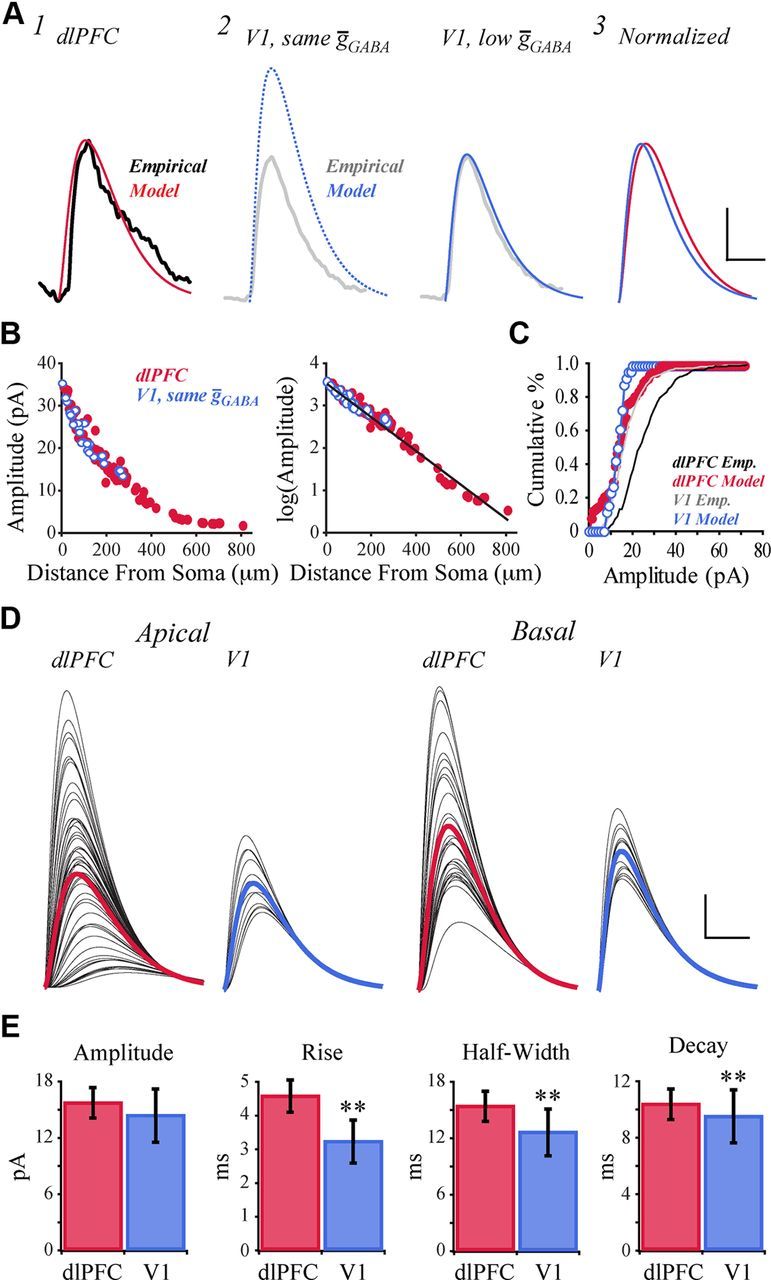
Whole-cell patch-clamp recordings and high-resolution 3D morphometric analyses of layer 3 pyramidal neurons in in vitro slices of monkey primary visual cortex (V1) and dorsolateral granular prefrontal cortex (dlPFC) revealed that neurons in these two brain areas possess highly distinctive structural and functional properties. Area V1 pyramidal neurons are much smaller than dlPFC neurons, with significantly less extensive dendritic arbors and far fewer dendritic spines. Relative to dlPFC neurons, V1 neurons have a significantly higher input resistance, depolarized resting membrane potential, and higher action potential (AP) firing rates. Most V1 neurons exhibit both phasic and regular-spiking tonic AP firing patterns, while dlPFC neurons exhibit only tonic firing. Spontaneous postsynaptic currents are lower in amplitude and have faster kinetics in V1 than in dlPFC neurons, but are no different in frequency. Three-dimensional reconstructions of V1 and dlPFC neurons were incorporated into computational models containing Hodgkin-Huxley and AMPA receptor and GABA(A) receptor gated channels. Morphology alone largely accounted for observed passive physiological properties, but led to AP firing rates that differed more than observed empirically, and to synaptic responses that opposed empirical results. Accordingly, modeling predicts that active channel conductances differ between V1 and dlPFC neurons. The unique features of V1 and dlPFC neurons are likely fundamental determinants of area-specific network behavior. The compact electrotonic arbor and increased excitability of V1 neurons support the rapid signal integration required for early processing of visual information. The greater connectivity and dendritic complexity of dlPFC neurons likely support higher level cognitive functions including working memory and planning.


Figures

Figure 1.
Figure 1.
Representative V1 and dlPFC cytoarchitecture. A, Photomicrographs of the rhesus monkey brain with black boxes indicating areas from which V1 (left, shaded in blue) or dlPFC (right, shaded in blue) blocks were taken. B, Nissl-stained 60 μm-thick sections of V1 (left) and dlPFC (right). Note the difference in thickness of layers 1–3, as well as the overall difference in layering pattern between the two brain areas. C, Photomicrographs of in vitro slices of V1 and dlPFC visualized under IR-DIC optics. Note the difference in size and density of neuronal somata in the two areas. Scale bars: B, 200 μm; C, 100 μm.
Figure 2.
Figure 2.
Imaging and reconstruction of V1 and dlPFC pyramidal neurons. A, B, The xy- and yz-projections of tiled 40× confocal microscopy image stacks of typical V1 (A) and dlPFC (B) neurons. At right, NeuronStudio reconstructions of the same neurons. Dendrites are shown in green; axons in red. Scale bars: A, B, 50 μm.
Figure 3.
Figure 3.
V1 pyramidal neuron dendritic arbors are smaller than those of dlPFC pyramidal neurons but have a similar arbor density. A, Reconstructions of neurons used for morphological analyses. Arrowheads indicate the cells used for computational modeling. B, CHs of the apical and basal arbors of a V1 neuron (marked with an arrowhead in A), in red and gray, respectively. C, Bar graphs of mean CH volumes (top) and mean arbor densities (bottom) of apical and basal arbors of V1 and dlPFC neurons. D, Scatter plot of log10-transformed CH volumes and arbor densities of neurons reconstructed in this study. Open and closed symbols denote V1 and dlPFC neurons, respectively. Each neuron is represented by a single symbol. Measurements of the apical (red), basal (black), and combined arbors (green) are shown separately. Scale bars: A, 100 μm; B, 50 μm. **p < 0.01.
Figure 4.
Figure 4.
V1 pyramidal neuron dendritic arbors are smaller and less complex than those of dlPFC pyramidal neurons. A, Sholl analysis of the apical tree, comparing the number of dendritic intersections in 20 μm increments (left), and in the proximal, middle, and distal thirds (right). B, Sholl analysis of the basal tree, comparing the number of dendritic intersections in 20 μm increments (left), and in the proximal, middle, and distal thirds (right). C, Bar graphs of mean diameters of distal apical, mid-apical, and basal dendrites of V1 and dlPFC neurons. *p < 0.05; **p < 0.01.
Figure 5.
Figure 5.
V1 neurons have fewer dendritic spines and a lower proportion of thin spines than dlPFC neurons. A1, 100× confocal image stacks of distal apical, mid-apical, and basal dendritic branches (black and white inverted). A2, Bar graph of mean dendritic spine density in apical and basal dendritic arbors of V1 versus dlPFC neurons. B1, Schematic diagram indicating dendritic spine subtype parameters. B2, 100× confocal images showing representative spine subtypes (t, thin; m, mushroom; s, stubby; and f, filopodia). B3, Pie charts showing relative proportions of each subtype in the entire population of spines for all V1 and dlPFC neurons. C, Line graphs showing the mean percentage composition of spine subtypes in distal apical (1), mid-apical (2), and basal (3) dendrites of V1 versus dlPFC neurons. Scale bars: A1, 5 μm; B2, 2 μm. *p < 0.05; **p < 0.01.
Figure 6.
Figure 6.
V1 neurons have higher input resistance and action potential firing rates than dlPFC neurons. A, Voltage responses (bottom) of representative V1 and dlPFC neurons to 200 ms current pulses (top, −40 to +40 pA). B, Voltage responses of representative neurons to 2 s current steps of +30, +80, and +130 pA. C, Left, Mean firing rates of V1 versus dlPFC neurons in response to a series of depolarizing current steps. V1 was significantly different from dlPFC at steps +20 to +280 pA (p < 0.05; asterisks omitted for the sake of clarity). Right, Relationship between input resistance and firing rate in response to a +130 pA current step for all V1 and dlPFC neurons. Linear regression (black line) demonstrates a significant positive correlation. D, Firing patterns observed in response to a current ramp protocol. All V1 neurons were capable of firing in a tonic pattern (left trace); most also were capable of firing in a phasic pattern (middle, different neuron from that shown at left). All dlPFC neurons fired tonically (right). Calibration: A, top, 60 pA/50 ms; A, bottom, 5 mV/50 ms; B, 20 mV/500 ms; D, 20 mV/1 s.
Figure 7.
Figure 7.
Spontaneous EPSCs are faster and lower in amplitude in V1 than in dlPFC neurons. A, Top, Representative traces of sEPSCs recorded from V1 and dlPFC neurons held at −80 mV. Bottom, Bar graphs comparing mean frequency, amplitude and area of sEPSCs in V1 versus dlPFC neurons. B1, Cumulative frequency histograms of sEPSC amplitudes in V1 versus dlPFC neurons (1 pA bins). B2, Amplitude frequency histogram, showing the number of events at each amplitude for V1 versus dlPFC neurons (1 pA bins). C, Top, Averaged waveforms from exemplar neurons. The waveform obtained from the V1 neuron was first overlaid onto the dlPFC waveform then normalized to the peak of the dlPFC waveform. Bottom, Bar graphs comparing mean kinetics of sEPSCs in V1 versus dlPFC neurons. Calibration: A, 20 pA/100 ms; C, 5 pA/20 ms. *p < 0.05; **p < 0.01.
Figure 8.
Figure 8.
Spontaneous IPSCs are lower in amplitude in V1 than in dlPFC neurons. A, Top, Representative traces of sIPSCs recorded from V1 and dlPFC neurons held at −40 mV. Bottom, Bar graphs comparing mean frequency, amplitude and area of sIPSCs in V1 versus dlPFC neurons. B1, Cumulative frequency histograms of sIPSC amplitudes in V1 versus dlPFC neurons (1 pA bins). B2, Amplitude frequency histogram, showing the number of events at each amplitude for V1 versus dlPFC neurons (1 pA bins). C, Top, Averaged waveforms from exemplar neurons. The waveform obtained from the V1 neuron was overlaid onto the dlPFC waveform. Bottom, Bar graphs comparing mean kinetics of sIPSCs in V1 versus dlPFC neurons. Calibration: A, 25 pA/100 ms; C, 5 pA/10 ms. *p < 0.05.
Figure 9.
Figure 9.
Electrotonic analyses of representative V1 and dlPFC neurons. A, B, Morphologic reconstructions, and outward and inward morphoelectrotonic transforms of the V1 (A) and dlPFC (B) neurons. Scale bars represent one-fourth an attenuation unit in the outward transforms, and one attenuation unit in the inward transforms. C, D, Effect of increasing frequency (0–500 Hz) on out (C) and in (D) of the V1 (open circles) and dlPFC (closed circles) neurons. Apical and basal arbors were analyzed separately, shown as red and black lines, respectively.
Figure 10.
Figure 10.
Computational modeling of passive and active properties of V1 and dlPFC neurons. A, Steady-state membrane potential versus injected subthreshold current for empirical (dashed lines) and model neurons (solid lines). Shown are output of the dlPFC model (red), the baseline V1 model using the same membrane parameters as in the dlPFC model (green), and the tuned V1 model (blue), tuned directly to the V1 empirical data. Lines indicate best linear fit to the corresponding data. B, Steady-state firing rate versus injected current of the empirical data and models. C, Top, Voltage traces of the empirical dlPFC and V1 neurons in response to a +230 pA somatic current injection, in black and gray, respectively. Bottom, Voltage traces of the models in response to a +230 pA somatic current injection. Left, The dlPFC model (red trace); middle, the baseline V1 model (green trace); right, the tuned V1 model (blue trace). Arrowheads indicate the afterhyperpolarizations of the dlPFC data and model, which account for most of the difference between the model and empirical traces. Calibration: C, 20 mV/50 ms.
Figure 11.
Figure 11.
EPSC simulations predict reduced conductance of AMPA receptor-gated channels in V1 versus dlPFC. A1, Mean EPSC of the dlPFC model (red), overlaying the representative EPSC recorded empirically from dlPFC neurons (black, from Fig. 7C). A2, Mean EPSC of the V1 model, using the same AMPA as the dlPFC model (left, blue dotted line), and when reducing AMPA by 69% (right, blue solid line). Model traces overlay the representative EPSC recorded empirically from V1 neurons (gray, from Fig. 7C). A3, Normalized overlay of mean EPSC traces of the dlPFC and low AMPA V1 models. B, Left, EPSC amplitude versus synaptic distance from the soma in the dlPFC model (red filled circles) and V1 model (blue open circles), assuming equal values of AMPA. Right, Log-transformed EPSC amplitudes versus synaptic distance from the soma. The best-fit linear regression of log(amplitude) versus distance is shown in black. C, Cumulative frequency histograms of EPSC amplitudes in the dlPFC and low-AMPA V1 models (1 pA bins; filled red circles and open blue circles, respectively). Cumulative frequency histograms of the dlPFC (black line) and V1 (gray line) empirical data are superimposed. D, EPSCs evoked by activation of each individual synapse on the apical and basal arbors, for the dlPFC and low-AMPA V1 models. Individual EPSCs shown in black; mean EPSC traces shown in color. E, Bar graphs comparing kinetics of EPSCs in dlPFC versus low-AMPA V1 model neurons. Calibration: A, 5 pA/20 ms; D, 5 pA/10 ms. **p < 0.01.
Figure 12.
Figure 12.
IPSC simulations predict reduced conductance of GABAA receptor-gated channels in V1 versus dlPFC. A1, Mean IPSC of the dlPFC model (red), overlaying the representative IPSC recorded empirically from dlPFC neurons (black, from Fig. 8C). A2, Mean IPSC of the V1 model, using the same GABA as the dlPFC model (left, blue dotted line), and when reducing GABA by 42% (right, blue solid line). Model traces overlay the representative IPSC recorded empirically from V1 neurons (gray, from Fig. 8C). A3, Normalized overlay of mean IPSC traces of the dlPFC and low-GABA V1 models. B, Left, IPSC amplitude versus synaptic distance from the soma in the dlPFC model (red filled circles) and V1 model (blue open circles), assuming equal values of GABA. Right, Log-transformed IPSC amplitudes versus synaptic distance from the soma. The best-fit linear regression of log(amplitude) versus distance is shown in black. C, Cumulative frequency histograms of IPSC amplitudes in the dlPFC and low-GABA V1 models (1 pA bins; filled red circles and open blue circles respectively). Cumulative frequency histograms of the dlPFC (black line) and V1 (gray line) empirical data are superimposed. D, IPSCs evoked by activation of each individual synapse on the apical and basal arbors, for the dlPFC and low-GABA V1 models. Individual IPSCs shown in black; mean IPSC traces shown in color. E, Bar graphs comparing kinetics of IPSCs in dlPFC versus low-GABA V1 model neurons. Calibration: A, D, 5 pA/10 ms. **p < 0.01.

References

    1. Acker CD, White JA. Roles of IA and morphology in action potential propagation in CA1 pyramidal cell dendrites. J Comput Neurosci. 2007;23:201–216. - PubMed
    1. Ascoli GA. Passive dendritic integration heavily affects spiking dynamics of recurrent networks. Neural Netw. 2003;16:657–663. - PubMed
    1. Barbas H. Architecture and cortical connections of the prefrontal cortex in the rhesus monkey. Adv Neurol. 1992;57:91–115. - PubMed
    1. Brown TH, Zador A, Mainen ZF, Claiborne BJ. Hebbian computations in hippocampal dendrites and spines. In: McKenna T, Davis J, Zornetzer SF, editors. Single neuron computation. San Diego: Academic; 1992. pp. 81–116.
    1. Budd JM. Extrastriate feedback to primary visual cortex in primates: a quantitative analysis of connectivity. Proc Biol Sci. 1998;265:1037–1044. - PMC - PubMed

Publication types

MeSH terms

LinkOut - more resources