. 2012 Oct 3;32(40):13987-99.
doi: 10.1523/JNEUROSCI.2433-12.2012.

TNiK is required for postsynaptic and nuclear signaling pathways and cognitive function

Affiliations

TNiK is required for postsynaptic and nuclear signaling pathways and cognitive function

Marcelo P Coba et al. J Neurosci. .

Abstract

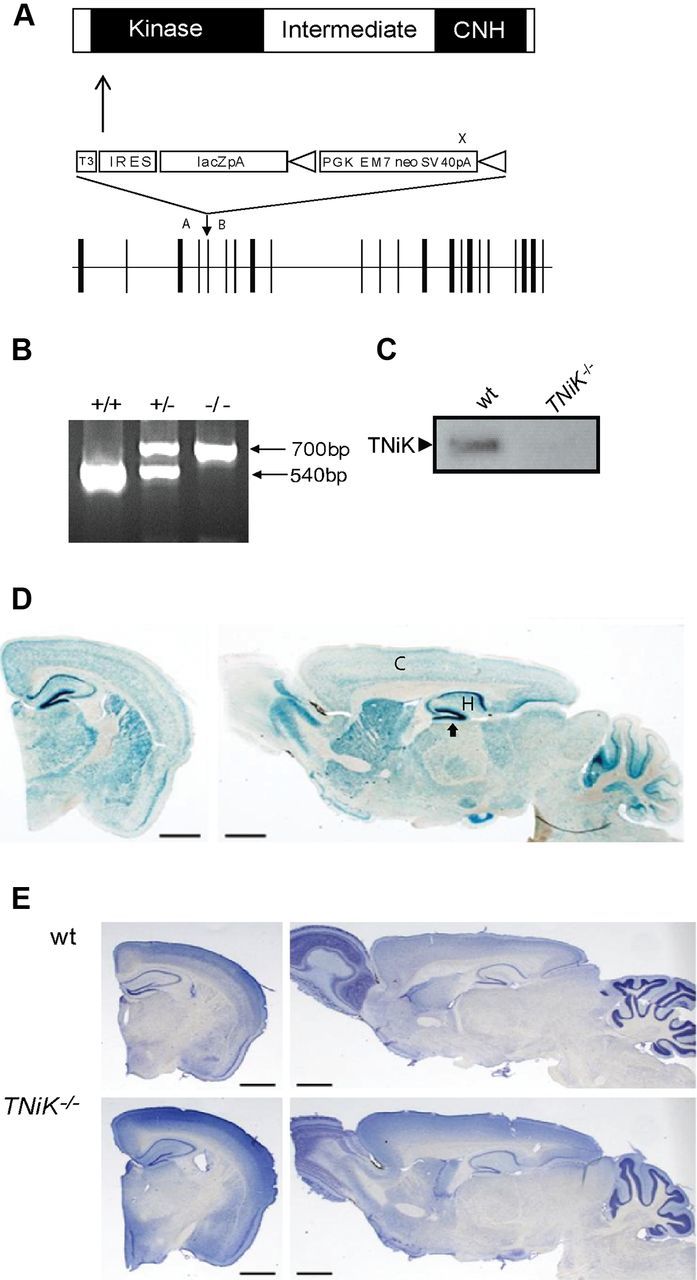
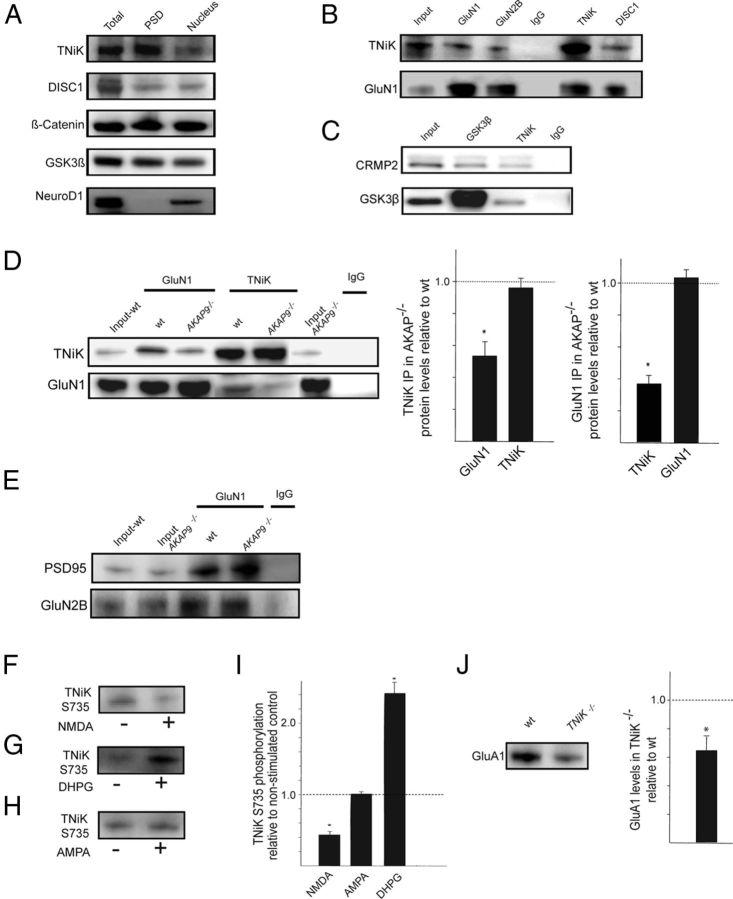
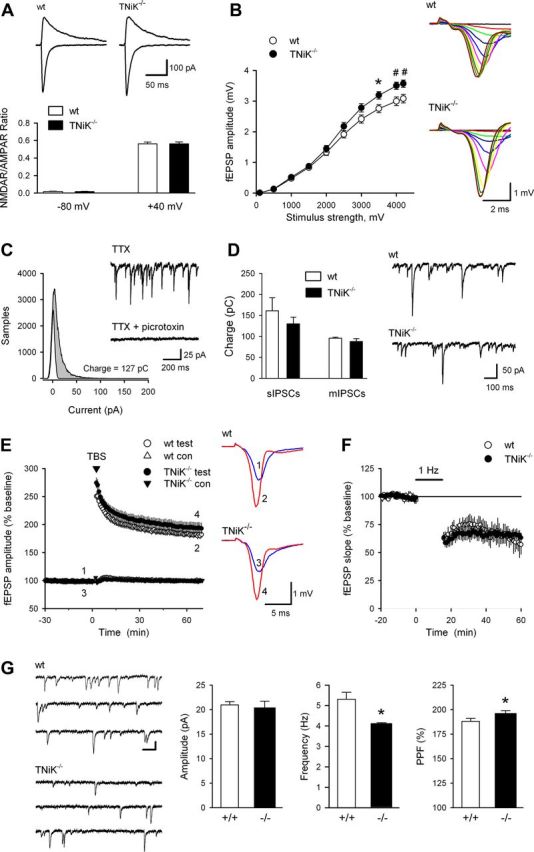
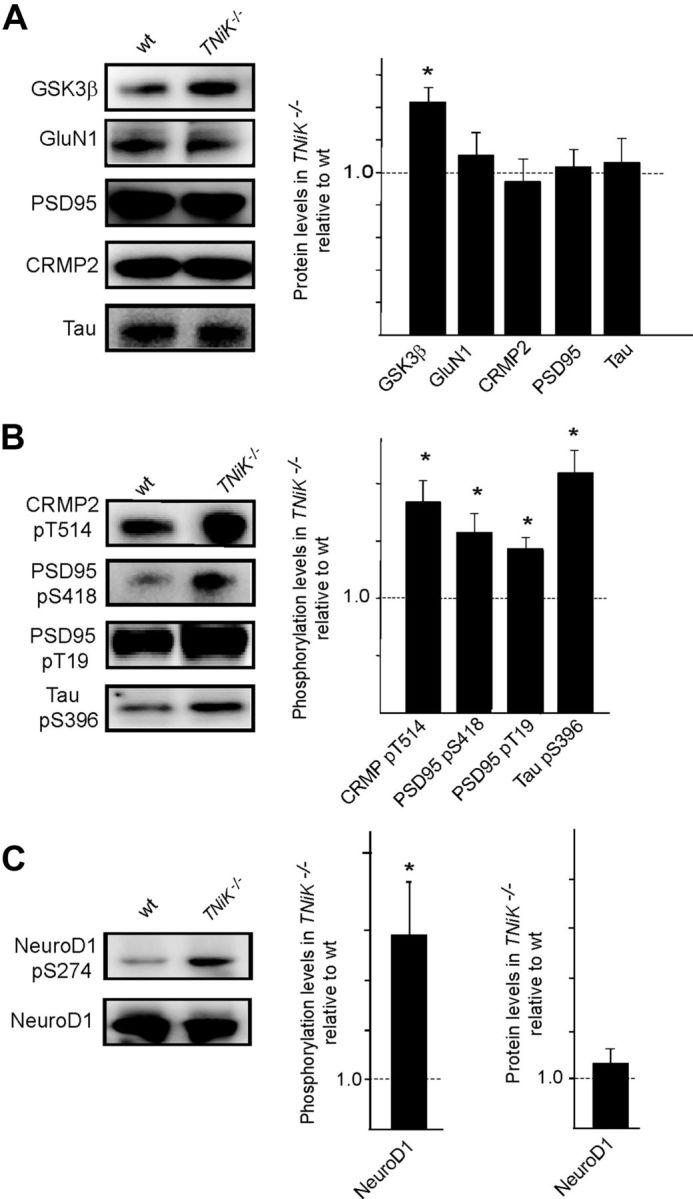
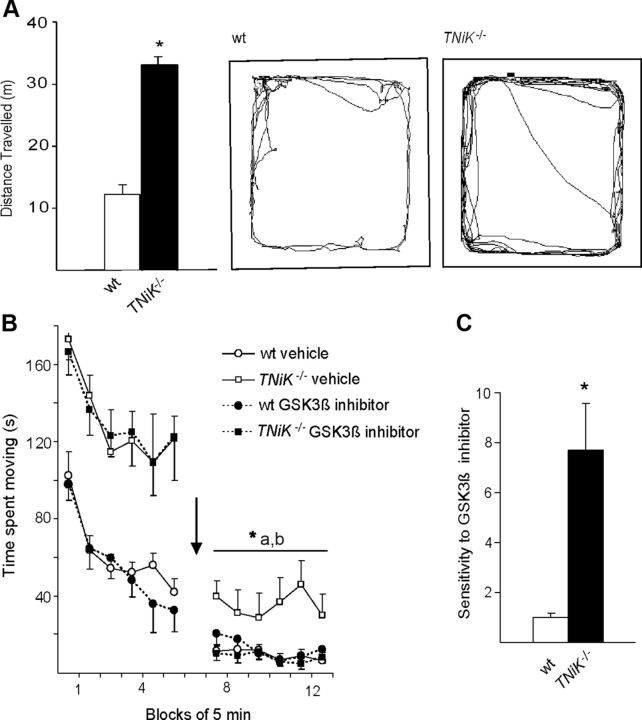
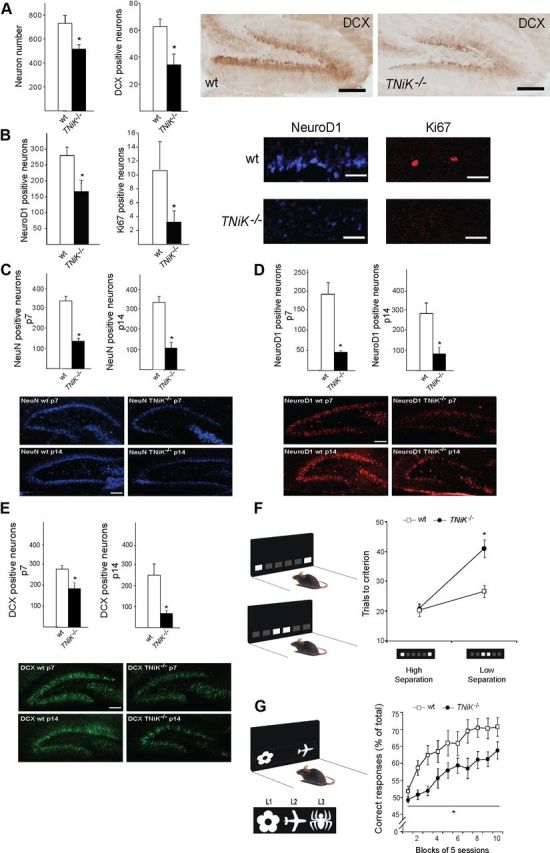
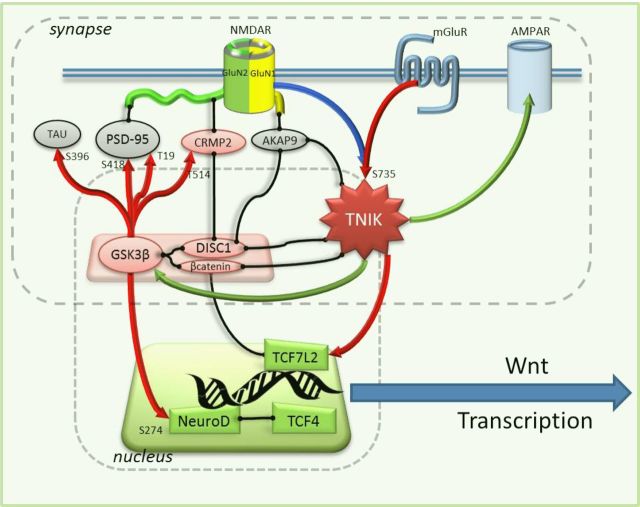
Traf2 and NcK interacting kinase (TNiK) contains serine-threonine kinase and scaffold domains and has been implicated in cell proliferation and glutamate receptor regulation in vitro. Here we report its role in vivo using mice carrying a knock-out mutation. TNiK binds protein complexes in the synapse linking it to the NMDA receptor (NMDAR) via AKAP9. NMDAR and metabotropic receptors bidirectionally regulate TNiK phosphorylation and TNiK is required for AMPA expression and synaptic function. TNiK also organizes nuclear complexes and in the absence of TNiK, there was a marked elevation in GSK3β and phosphorylation levels of its cognate phosphorylation sites on NeuroD1 with alterations in Wnt pathway signaling. We observed impairments in dentate gyrus neurogenesis in TNiK knock-out mice and cognitive testing using the touchscreen apparatus revealed impairments in pattern separation on a test of spatial discrimination. Object-location paired associate learning, which is dependent on glutamatergic signaling, was also impaired. Additionally, TNiK knock-out mice displayed hyperlocomotor behavior that could be rapidly reversed by GSK3β inhibitors, indicating the potential for pharmacological rescue of a behavioral phenotype. These data establish TNiK as a critical regulator of cognitive functions and suggest it may play a regulatory role in diseases impacting on its interacting proteins and complexes.


Figures

Figure 1.
Figure 1.
TNiK knock-out mice. A, Targeting vector for the generation of TNiK knock-out mice. Linear structure of TNiK protein showing kinase, intermediate, and citron homology (CNH) domain. Arrow indicates N-terminal point of targeted deletion. Middle, Shows gene targeting vector containing the IRES-lacZ-neo reporter cassette. Bottom, Shows the genomic locus (exons; vertical bars). Vector sequences include: T3, triple termination sequence; IRES; LacZpA, β-galactosidase reporter with polyA sequence; and triangles flanking PGKEM7neoSV40pA (selection cassette) are loxP recombination sites. PCR genotyping primer sites, A, B, and X. B, Genotyping heterozygous and homozygous mice. A 540 bp product was amplified from the wt allele using primers A and B and a 700 bp product amplified from the targeted allele using primers B and X. C, Immunoblot with TNiK antibodies of total hippocampal lysates shows absence of TNiK protein in TNiK−/− mice. D, Brain expression of TNiK. Coronal and sagittal brain section stained with X-gal in TNiK−/− mice. C, cortex; H, hippocampus. Arrow to dentate gyrus. Scale bar, 1.4 mm. E, Coronal and sagittal brain sections stained with Nissl from adult wt and TNiK−/− mice. Scale bar, 1.4 mm.
Figure 2.
Figure 2.
Postsynaptic TNiK complexes and increased GSK3β signaling in TNiK−/− mice. A, Immunoblot showing TNiK, DISC1, β-catenin, and GSK3β in total hippocampal lysates, PSD, and nucleus fraction. The transcription factor NeuroD1 was found only in the nuclear fraction and absent from the PSD. B, TNiK, NMDAR, and DISC1 complexes. PSD lysates (input) were immunoprecipitated with antibodies to GluN1, GLuN2B, TNiK, DISC1, and control IgG (labels above the blots) and immunoblotted with antibodies to TNiK and GluN1 (labels to left of blots). C, TNiK, CRMP2, and GSK3β complexes. PSD lysates were immunoprecipitated with antibodies to TNiK, GSK3β, and control IgG and immunoblotted with antibodies to CRMP2 and GSK3β. Labeled as in B. D, IP with GluN1 antibodies and control IgG, and Western blot against TNiK in wt and AKAP9−/− mice (left) showed a 52% reduction (p < 0.05) (right). Reciprocal IP with TNiK and GluN1 antibodies and Western blot against GluN1 in wt and AKAP9 mutant mice (left) observed a 63% reduction (p < 0.05; right). The total levels of TNiK and GluN1 were not altered in AKAP9−/− mice (lanes 1 and 6). E, Unaltered GluN1, GluN2B, and PSD95 complexes in AKAP9−/− mice. Wt and AKAP9 mutant input extracts are indicated and immunoprecipitating antibody is shown above the blot. F–I, Glutamate receptors modulate bidirectional phosphorylation of TNiK. F, TNiK S735 phosphorylation measured by immunoblot of PSD lysates from hippocampal slices stimulated with NMDA. G, TNiK S735 phosphorylation measured by immunoblot of PSD lysates from hippocampal slices stimulated with the metabotropic agonist dihydroxyphenylglycine (DHPG). H, TNiK S735 phosphorylation measured by immunoblot of PSD lysates from hippocampal slices stimulated with AMPA. I, NMDAR activation in hippocampal slices decreases TNiK S735 phosphorylation; activation of metabotropic glutamate receptors type I (mGluRI) with DHPG produced an increase in S735 phosphorylation, while AMPA activation had no effect. J, PSD lysates were immunoblotted with antibody to GluA1. Histogram shows 35% decrease (p < 0.05).
Figure 3.
Figure 3.
Synaptic physiology in TNiK−/− mice. A, NMDAR-mediated EPSCs are normal in TNiK−/− mice. Traces (top) show EPSCs recorded at −80 and +40 mV in pyramidal cells from a wt (left) and TNiK−/− mouse (right). Calibration bars are 100 pA and 25 ms. The ratios of NMDAR-mediated EPSCs to AMPAR-mediated EPSCs measured at −80 and +40 mV (bottom) are not significantly different in TNiK−/− mice (n = 17; N = 3) compared with wt littermates (n = 17; N = 3). B, Baseline synaptic transmission was slightly but significantly enhanced in TNiK−/− mice. Input–output relationships illustrate averaged fEPSP amplitudes in slices from TNiK−/− (n = 28; N = 10) and wt mice (n = 32; N = 10) in response to stimulation of Schäffer collaterals by biphasic voltage pulses of 0.1–4.2 V (*p < 0.05, #p < 0.01). Amplitudes of fEPSPs evoked by maximum 4.2 V stimulation were significantly increased in TNiK mice (F(1,40) = 9.18; p = 0.004, two-way nested ANOVA, main genotype effect). Representative families of fEPSP traces are shown at right. Calibration bars are 1 mV and 2 ms. C, Spontaneously occurring IPSCs were recorded in cells voltage-clamped at −70 mV and all-points histograms were generated from 10 s long segments of data. Points corresponding to baseline noise were estimated from the Gaussian curve centered on 0 pA. The difference between this area and the remaining area under the histogram corresponds to the currents generated by the IPSCs (shaded area) and was used to calculate total charge transfer. Traces show mIPSCs recorded before and after bath application of picrotoxin (100 μm). D, Comparison of sIPSC and mIPSC charge transfer in wt (open bars) and TNiK−/− cells (filled bars). Spontaneous IPSCs (recorded in the absence of TTX) in cells from TNiK−/− mice (n = 10 cells from 4 mice) are not significantly different from that seen in wt cells (n = 10 cells from 4 mice, p = 0.41). Total charge transfer due to mIPSCs is also similar in TNiK−/− (n = 13 cells from 4 mice) and wt mice (n = 15 cells from 3 mice, p = 0.39). Traces show sIPSCs recorded from CA1 pyramidal cells in slices from wt and TNiK−/− mice. E, Theta-burst stimulation elicited pathway-specific LTP of synaptic transmission in hippocampal CA1 area. Normalized magnitude of this potentiation 60–65 min after LTP induction was identical in mutant mice (189 ± 5%; n = 28; N = 10; p = 0.94) and their wt littermates (189 ± 4%; n = 32; N = 10). Traces show examples of test pathway fEPSPs evoked immediately before and 1 h after theta-burst stimulation. F, Hippocampal LTD induced by 1 Hz stimulation (900 pulses) is normal in TNiK−/− mice. At 45 min post 1 Hz stimulation fEPSPs were reduced to 65 ± 4% of baseline in slices from TNiK−/− mice (n = 11; N = 5) compared with 60 ± 9% of baseline in slices from wt mice (n = 5; N = 3). G, Frequency of spontaneous mEPSCs is significantly reduced in TNiK−/− mice. Traces (left) show consecutive sweeps of mEPSCs recorded in a wt cell (top, n = 14; N = 3) and a TNiK−/− cell (bottom, n = 14; N = 3). Calibration bars are 100 ms and 15 pA. Histograms (right) show the amplitude, and frequency of mEPSPs as well as PPF of fEPSPs (50 ms interpulse interval) in TNiK−/− mice compared with wt mice (*p < 0.05).
Figure 4.
Figure 4.
Elevated GSK3β levels in TNiK−/− mice. A, Immunoblots of GSK3β, GluN1, PSD-95, CRMP2, and Tau in PSD lysates from wt and TNiK−/− mice. Histograms show protein levels in TNiK−/− mice PSD normalized to wt levels. B, PSD lysates were immunoblotted with phospho-specific antibodies showing increased phosphorylation of CRMP2 threonine 514, PSD-95 serine 418 and threonine 19, and tau serine 396 in TNiK−/− mice. C, Hippocampal lysates were immunoblotted with phospho-specific antibodies to serine 294 on NeuroD1 (top) and total NeuroD1 (bottom) and levels in TNiK−/− mice quantified relative to wt in histograms. Images show representative Western blot assays from at least triplicate experiments. Asterisk indicates significant difference to wt (p < 0.05).
Figure 5.
Figure 5.
Inhibition of GSK3β reverses hyperactivity in TNiK−/− mice. A–C, Locomotor activity was assessed in an open field chamber and total distance moved measured (A). Representative tracks of wt (A, left) and TNiK−/− (A, right) mice in the open field. GSK3β inhibition on locomotor activity (B) was assessed by placing TNiK−/−and wt mice in an activity chamber for an initial period of 30 min, then mice were injected (indicated by arrow) with either vehicle or a GSK3β inhibitor (SB 216763; 10 mg/kg body weight, i.p.) and monitored for a further period of 30 min starting 10 min after injection. Sensitivity to GSK3β (C) was calculated as a ratio of change in locomotor activity between administration of vehicle and GSK3β inhibitor. *p < 0.05; **p < 0.01; ***p < 0.005; a = TNiK−/− vehicle versus wt vehicle; b = TNiK−/− vehicle versus TNiK−/− GSK3β inhibitor.
Figure 6.
Figure 6.
Impaired dentate gyrus neurogenesis and cognition in TNiK−/− mice. A, B, Histograms comparing dentate gyrus granule cell number and cells stained with markers relevant to neurogenesis (see text) in wt and TNiK−/− mice brain sections. Representative images of dentate gyrus cells in wt and TNiK−/− brain sections stained with markers for DCX (A), NeuroD1, and Ki67 (B). Scale bars: (in A) 200 and (in B) 60 μm. C–E, Hippocampus development in TNiK−/− mice. Number of NeuN-positive neurons at P7 (upper, left histogram) and P14 (lower, right histogram) in wt and TNiK−/− mice (C). Number of NeuroD1-positive neurons at P7 (upper, left histogram) and P14 (lower, right histogram) in wt and TNiK−/− mice (D). Number of DCX-positive neurons at P7 (upper, left histogram) and P14 (lower, right histogram) in wt and TNiK−/− mice (E). Scale bars: 100 μm. F, Pattern separation was assessed using a two-choice spatial discrimination task in the touchscreen-based operant system. Mice were trained to discriminate the correct spatial location between two illuminated squares, located in two of six possible locations. Pattern separation was tested by varying the distance between the choice locations, either situated far apart (high degree of separation; top) or close together (low degree of separation; bottom). TNiK−/− mice performed as well as wt mice when stimuli were separated by a high degree of separation; however, they showed a significant impairment (p < 0.05) in discrimination when the locations were in close proximity. As a control measure, analysis of response reaction times showed no significant differences between groups at either separation (high separation, wt = 5.0 ± 1.1 s, TNiK−/− = 5.2 ± 0.8s; low separation, wt = 4.9 ± 0.7 s, TNiK−/− = 5.0 ± 0.9 s). G, TNiK−/− mice show a deficit in object-location associative learning (significant effect of genotype, p < 0.05) where mice were tested for the ability to associate between three objects (flower, plane, and spider) with their correct spatial locations on the screen [left (L1), middle (L2), and right (L3), respectively].
Figure 7.
Figure 7.
Postnatal expression profile of TNiK. A, Sagittal sections showing expression pattern of TNiK using X-gal staining in TNiK−/− mice at P7, 14, and 20. Scale bar, 100 μm. B, Detailed expression pattern of TNiK using X-gal staining of hippocampal area. Scale bar, 200 μm. DG, dentate gyrus; GCL, granule cell layer; ML, molecular layer; PCL, pyramidal cell layer.
Figure 8.
Figure 8.
Molecular functions of TNiK. The molecular functions of TNiK in the PSD and nucleus are shown. Proteins are shown as colored shapes and grouped into their synaptic and nuclear locations. Black lines connecting proteins show known protein–protein interactions. Arrows show regulatory interactions: red, phosphorylation (phosphorylated amino acid residue indicated with number and letter); blue, dephosphorylation; green, regulates protein level.

References

    1. Al-Hallaq RA, Conrads TP, Veenstra TD, Wenthold RJ. NMDA di-heteromeric receptor populations and associated proteins in rat hippocampus. J Neurosci. 2007;27:8334–8343. - PMC - PubMed
    1. Andrásfalvy BK, Smith MA, Borchardt T, Sprengel R, Magee JC. Impaired regulation of synaptic strength in hippocampal neurons from GluR1-deficient mice. J Physiol. 2003;552:35–45. - PMC - PubMed
    1. Ayalew M, Le-Niculescu H, Levey DF, Jain N, Changala B, Patel SD, Winiger E, Breier A, Shekhar A, Amdur R, Koller D, Nurnberger JI, Corvin A, Geyer M, Tsuang MT, Salomon D, Schork NJ, Fanous AH, O'Donovan MC, Niculescu AB. Convergent functional genomics of schizophrenia: from comprehensive understanding to genetic risk prediction. Mol Psychiatry. 2012;17:887–905. - PMC - PubMed
    1. Bakker A, Kirwan CB, Miller M, Stark CE. Pattern separation in the human hippocampal CA3 and dentate gyrus. Science. 2008;319:1640–1642. - PMC - PubMed
    1. Barbosa-Morais NL, Dunning MJ, Samarajiwa SA, Darot JF, Ritchie ME, Lynch AG, Tavaré S. A re-annotation pipeline for Illumina BeadArrays: improving the interpretation of gene expression data. Nucleic Acids Res. 2010;38:e17. - PMC - PubMed

Publication types

MeSH terms