Review
doi: 10.1017/S0031182012000698.
Epub 2012 Jul 19.
Spatial parasite ecology and epidemiology: a review of methods and applications
Affiliations
- PMID: 23036435
- PMCID: PMC3526959
- DOI: 10.1017/S0031182012000698
Item in Clipboard
Review
Spatial parasite ecology and epidemiology: a review of methods and applications
Parasitology.
2012 Dec.
Free PMC article
Abstract
The distributions of parasitic diseases are determined by complex factors, including many that are distributed in space. A variety of statistical methods are now readily accessible to researchers providing opportunities for describing and ultimately understanding and predicting spatial distributions. This review provides an overview of the spatial statistical methods available to parasitologists, ecologists and epidemiologists and discusses how such methods have yielded new insights into the ecology and epidemiology of infection and disease. The review is structured according to the three major branches of spatial statistics: continuous spatial variation; discrete spatial variation; and spatial point processes.
Figures
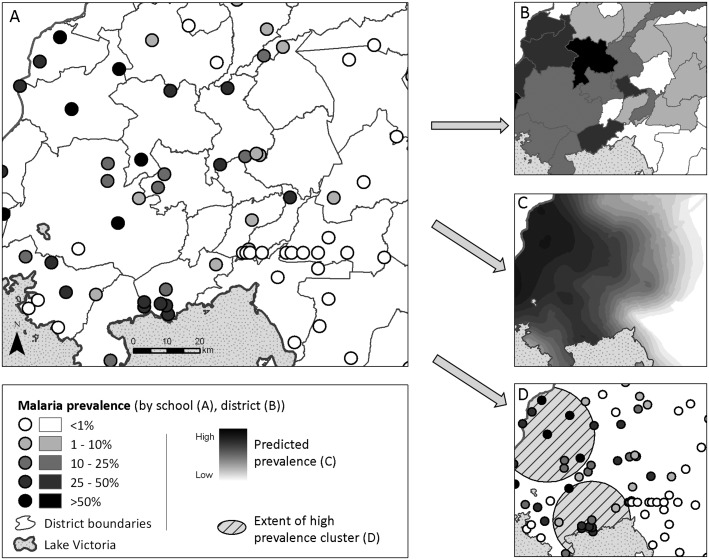
An illustrated application of the three major branches of spatial statistics, using one dataset. (A) Data used for analysis: Point-level (school-level) malaria prevalence data for Western Kenya, collected during the National School Malaria Survey, 2010 (Gitonga et al. 2010). (B) Discrete spatial analysis: data are aggregated to the area level (in this case, mean district prevalence) for presentation and analysis. Discrete spatial statistics can be used to smooth between units, or investigate associations with covariates. (C) Continuous spatial analysis: characterizes spatial dependency (or autocorrelation) between points, and can be used to interpolate predicted outcomes across the entire study region (in this case, using Ordinary Kriging (Goovaerts, 1997)). (D) Spatial point processes: used to investigate the location of individual spatial clusters (indicated as hatched circles) in the outcome (in this case, Kulldorf's spatial scan statistic (Kulldorff and Nagarwalla, 1995)).
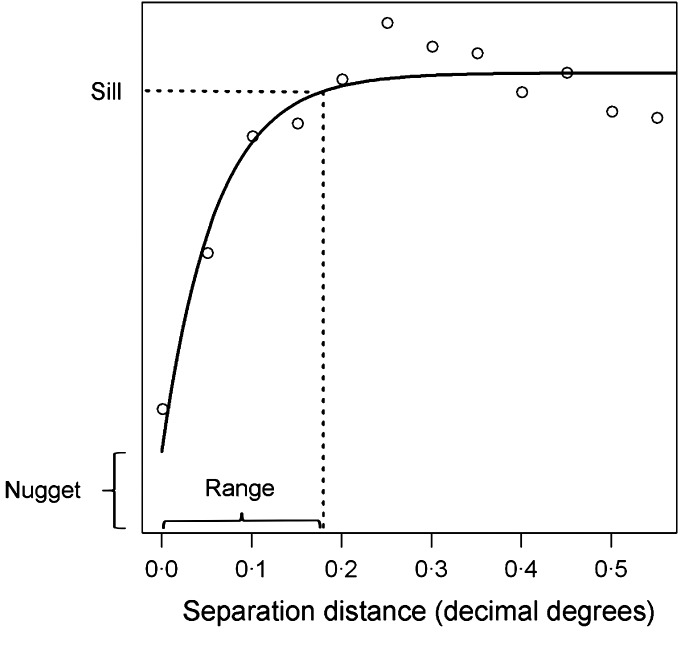
An example of a semi-variogram, showing its major components. The range represents the separation distance, at which 95% of sill variance is reached, and here is approximately 20 km. The nugget represents the stochastic variation between points, measurement error or spatial autocorrelation over distances smaller than those represented in the data. Data are from a school-based survey of blood in urine indicative of genitourinary schistosomiasis from Coast province, Kenya (Kihara et al. 2011) and were de-trended (i.e. first order spatial structure was removed) using a quadratic trend surface.
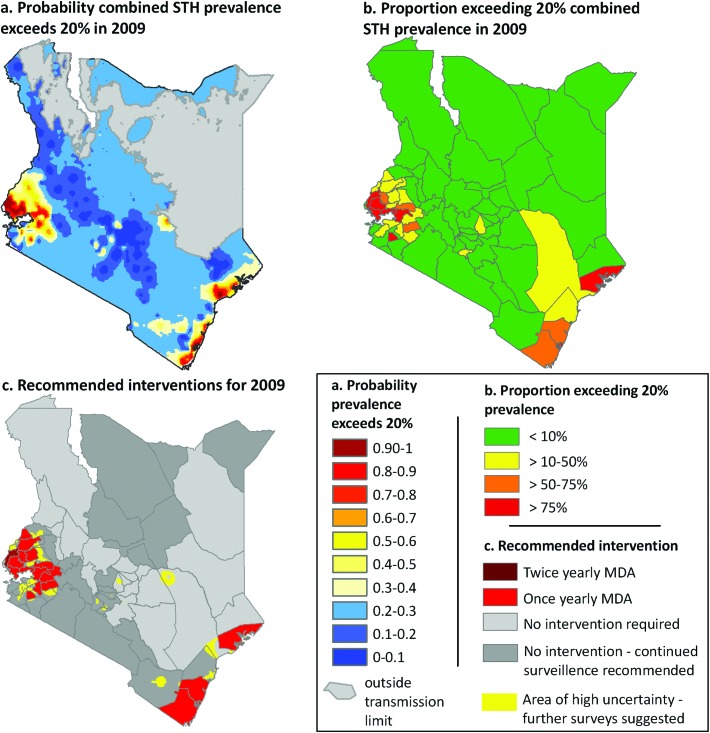
An example of the practical applications of a model-based geostatistical (MBG) predictive mapping of soil-transmitted helminths (STH). (a) Bayesian space-time geostatistical models were developed for each STH species using survey data from 1980–2009, and were used to interpolate the probability that combined infection prevalence exceeded the 20% level defined by the World Health Organisation as a mass drug administration (MDA) threshold in 2009. (b) Population census data were overlaid with the probability models to estimate the proportion of the population at risk (i.e. >50% probability of exceeding 20% prevalence threshold) and requiring treatment in 2009 for each district. Recommended intervention districts (c) are defined as: once yearly mass drug administration (MDA), at least 33% of the district exceeds 20% prevalence threshold, and twice yearly MDA, at least 33% of the district exceeds a 50% prevalence threshold. Continued surveillance is recommended for districts where historically >75% of the district exceeded the 20% prevalence based on predictions for 1999, and areas of high uncertainty are those where we can only be 50–65% certain that prevalence is lower than 20%. Adapted from Pullan et al. 2011.
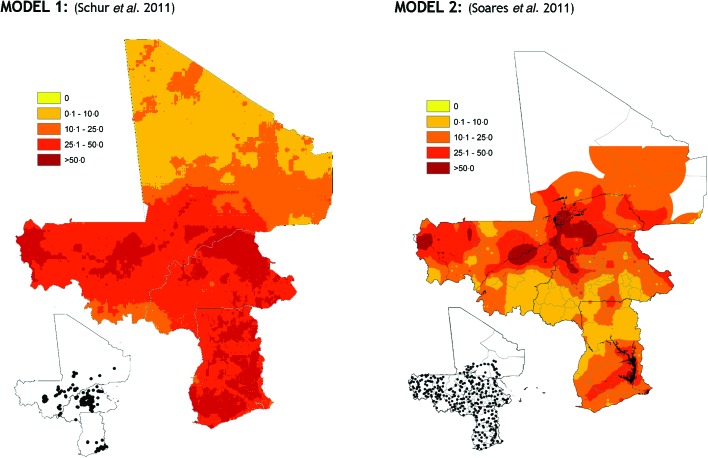
Contrasting predictions of the distribution of Schistosomiasis haematobium generated using similarly robust MBG regression models, but different data. Model 1: Predicted prevalence of S. haematobium among individuals aged ⩽20 years during the period of 2000–2009, based on survey data from 16 West African countries. Model 2: Predicted prevalence of S. haematobium infection in boys aged 10–15 years in Burkina Faso, Mali and Ghana in 2004–2006. Inset maps show the location of survey data used in each model. Although overall trends are similar, these models show considerable differences in within country distributions, particularly in northern Burkina Faso, central Mali and much of Ghana. Figures are adapted from Schur et al. 2011 and Soares et al. 2011.
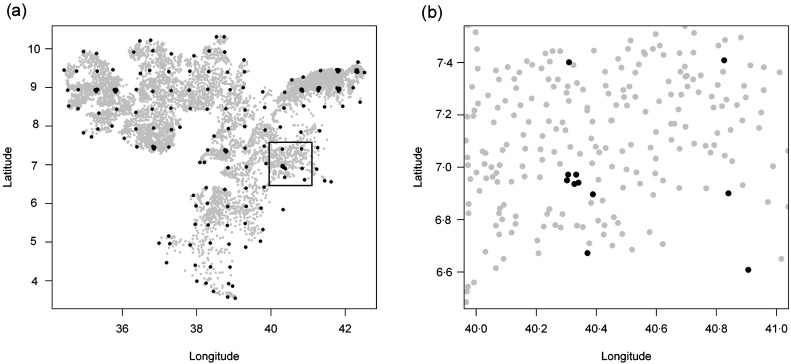
(a) Illustrative example of the lattice plus close pairs design using a grid size of 50 km to select schools for surveys of S. mansoni in Oromia Regional State, Ethiopia. Dark points refer to selected schools and gray points to unselected schools. (b) A close-up of a region (black box in a) showing the locations of some of the clusters of closely located schools. Adapted from Sturrock et al. (2011).
References
-
- Alexander F. E. and Boyle P. (2001). Do cancers cluster? In Spatial Epidemiology, Methods and Applications (eds. Elliott P., Wakefield J. C., Best N. G. & Briggs D. J.), pp. 302–316 Oxford University Press, Oxford
-
- Alexander N., Moyeed R. and Stander J. (2000). Spatial modelling of individual-level parasite counts using the negative binomial distribution. Biostatistics 1, 453–463 - PubMed
-
- Almeida M. C., Assuncao R. M., Proietti F. A. and Caiaffa W. T. (2008). [Intra-urban dynamics of dengue epidemics in Belo Horizonte, Minas Gerais State, Brazil, 1996–2002]. Cadernos de Saúde Pública 24, 2385–2395 - PubMed
-
- Altham P. M. E. (1984). Improving the precision of estimation by fitting a model. Journal of the Royal Statistical Society (Series B) 46, 118–119
-
- Anderson R. M. (1993). Epidemiology In Modern Parasitology (ed. Cox F. E. G.), pp. 75–116 Blackwell Science, Oxford
Publication types
MeSH terms
Grants and funding
LinkOut - more resources
Full Text Sources
Medical