Prediction of Alzheimer's disease in subjects with mild cognitive impairment from the ADNI cohort using patterns of cortical thinning
- PMID: 23036450
- PMCID: PMC4237400
- DOI: 10.1016/j.neuroimage.2012.09.058
Prediction of Alzheimer's disease in subjects with mild cognitive impairment from the ADNI cohort using patterns of cortical thinning
Abstract
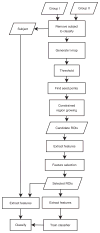
Predicting Alzheimer's disease (AD) in individuals with some symptoms of cognitive decline may have great influence on treatment choice and disease progression. Structural magnetic resonance imaging (MRI) has the potential of revealing early signs of neurodegeneration in the human brain and may thus aid in predicting and diagnosing AD. Surface-based cortical thickness measurements from T1-weighted MRI have demonstrated high sensitivity to cortical gray matter changes. In this study we investigated the possibility for using patterns of cortical thickness measurements for predicting AD in subjects with mild cognitive impairment (MCI). We used a novel technique for identifying cortical regions potentially discriminative for separating individuals with MCI who progress to probable AD, from individuals with MCI who do not progress to probable AD. Specific patterns of atrophy were identified at four time periods before diagnosis of probable AD and features were selected as regions of interest within these patterns. The selected regions were used for cortical thickness measurements and applied in a classifier for testing the ability to predict AD at the four stages. In the validation, the test subjects were excluded from the feature selection to obtain unbiased results. The accuracy of the prediction improved as the time to conversion from MCI to AD decreased, from 70% at 3 years before the clinical criteria for AD was met, to 76% at 6 months before AD. By inclusion of test subjects in the feature selection process, the prediction accuracies were artificially inflated to a range of 73% to 81%. Two important results emerge from this study. First, prediction accuracies of conversion from MCI to AD can be improved by learning the atrophy patterns that are specific to the different stages of disease progression. This has the potential to guide the further development of imaging biomarkers in AD. Second, the results show that one needs to be careful when designing training, testing and validation schemes to ensure that datasets used to build the predictive models are not used in testing and validation.
Copyright © 2012 Elsevier Inc. All rights reserved.
Figures


References
Publication types
MeSH terms
Grants and funding
LinkOut - more resources
Full Text Sources
Other Literature Sources
Medical
Miscellaneous

