. 2012 Dec 7;287(50):41628-39.
doi: 10.1074/jbc.M112.358788. Epub 2012 Oct 4.

Ciliary neurotrophic factor protects mice against streptozotocin-induced type 1 diabetes through SOCS3: the role of STAT1/STAT3 ratio in β-cell death

Affiliations

Ciliary neurotrophic factor protects mice against streptozotocin-induced type 1 diabetes through SOCS3: the role of STAT1/STAT3 ratio in β-cell death

Luiz F Rezende et al. J Biol Chem. .

Abstract

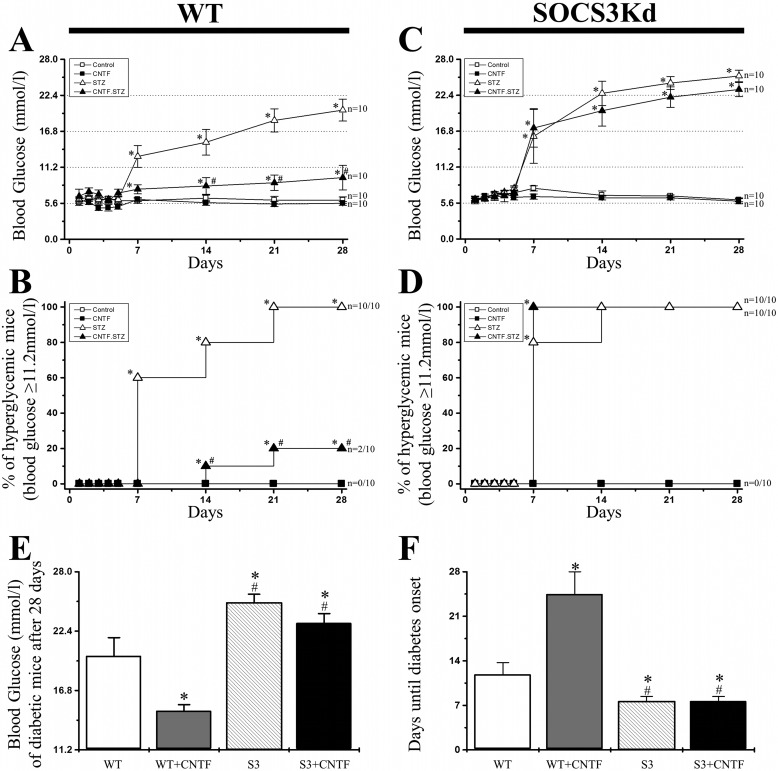
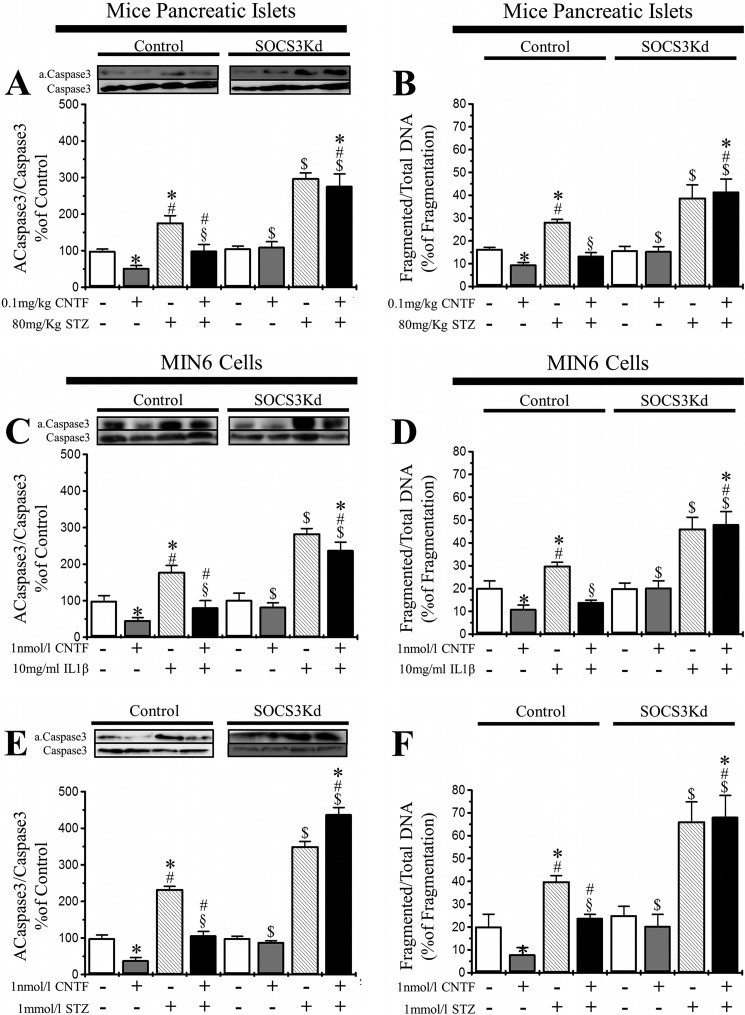
Type 1 diabetes is characterized by a loss of islet β-cells. Ciliary neurotrophic factor (CNTF) protects pancreatic islets against cytokine-induced apoptosis. For this reason, we assessed whether CNTF protects mice against streptozotocin-induced diabetes (a model of type 1 diabetes) and the mechanism for this protection. WT and SOCS3 knockdown C57BL6 mice were treated for 5 days with citrate buffer or 0.1 mg/kg CNTF before receiving 80 mg/kg streptozotocin. Glycemia in non-fasted mice was measured weekly from days 0-28 after streptozotocin administration. Diabetes was defined as a blood glucose > 11.2 mmol/liter. Wild-type (WT) and SOCS3 knockdown MIN6 cells were cultured with CNTF, IL1β, or both. CNTF reduced diabetes incidence and islet apoptosis in WT but not in SOCS3kd mice. Likewise, CNTF inhibited apoptosis in WT but not in SOCS3kd MIN6 cells. CNTF increased STAT3 phosphorylation in WT and SOCS3kd mice and MIN6 cells but reduced STAT1 phosphorylation only in WT mice, in contrast to streptozotocin and IL1β. Moreover, CNTF reduced NFκB activation and required down-regulation of inducible NO synthase expression to exert its protective effects. In conclusion, CNTF protects mice against streptozotocin-induced diabetes by increasing pancreatic islet survival, and this protection depends on SOCS3. In addition, SOCS3 expression and β-cell fate are dependent on STAT1/STAT3 ratio.


Figures

FIGURE 1.
FIGURE 1.
CNTF protects wild-type but not SOCS3kd mice against STZ-induced diabetes. Wild-type and SOCS3kd C57BL6 mice were treated with citrate buffer (white squares), 0.1 mg/kg CNTF (black squares), 80 mg/kg streptozotocin (white triangles), or both (black triangles). Diabetes was considered when blood glucose of non-fasted mice ≥ 11.2mmol/liter for two consecutive days. Blood glucose (mmol/liter; A) and diabetes incidence (%; B) of wild-type mice are shown. Blood glucose (mmol/liter; C) and diabetes incidence (%; D) of SOCS3kd mice are shown. E, blood glucose (mmol/liter) of wild-type and SOCS3kd mice with diagnosed type 1 diabetes 28 days after streptozotocin administration. F, days after streptozotocin administration until type 1 diabetes onset in wild-type and SOCS3kd (S3) mice. White bars, control; gray bars, CNTF; hatched bars, streptozotocin; and black bars, CNTF+streptozotocin (n = 10). Data are means ± S.E. *, significantly different from control. #, significantly different from CNTF. †, significantly different from streptozotocin.
FIGURE 2.
FIGURE 2.
CNTF, STZ, and IL1β increased SOCS3 expression on islets and MIN6 cells. Shown is the SOCS3 expression of pancreatic islets from wild-type and SOCS3kd C57BL6 mice treated with citrate buffer (white bars), 0.1 mg/kg of CNTF (gray bars), 80 mg/kg of streptozotocin (hatched bars), or both (black bars) (n = 4). Data are means ± S.E. *, significantly different from control; #, significantly different from CNTF; †, significantly different from streptozotocin; $, significantly different from respective wild-type group. Shown is the SOCS3 expression of wild-type and SOCS3kd MIN6 cells treated with citrate buffer (white bars), 1 nmol/liter CNTF (gray bars), 10 ng/ml IL1β (hatched bars), or both (black bars) (n = 4). Data are means ± S.E. *, significantly different from control; #, significantly different from CNTF; †, significantly different from IL1β; $, significantly different from respective wild-type group. Shown is the SOCS3 expression of wild-type and SOCS3kd MIN6 cells treated with citrate buffer (white bars), 1 nmol/liter of CNTF (gray bars), 1mmol/liter STZ (hatched bars), or both (black bars) (n = 4). Data are means ± S.E. *, significantly different from control; #, significantly different from CNTF; †, significantly different from STZ; $, significantly different from respective wild-type group.
FIGURE 3.
FIGURE 3.
CNTF prevents apoptosis from WT but not from SOCS3kd islets and MIN6 cells. Caspase-3 cleavage (A) and DNA fragmentation (B) of pancreatic islets from wild-type and SOCS3kd C57BL6 mice treated with citrate buffer (white bars), 0.1 mg/kg of CNTF (gray bars), 80 mg/kg of streptozotocin (hatched bars), or both (black bars) (n = 4). Data are means ± S.E. *, significantly different from control; #, significantly different from CNTF; †, significantly different from streptozotocin; $, significantly different from respective wild-type group. Shown are caspase-3 cleavage, meant as Activate Caspase 3 (ACaspase3)/Caspase3 ratio (C) and DNA fragmentation (D) of wild-type and SOCS3kd MIN6 cells treated with citrate buffer (white bars), 1 nmol/liter of CNTF (gray bars), 10 ng/ml of IL1β (hatched bars), or both (black bars) (n = 4). Data are means ± S.E. *, significantly different from control; #, significantly different from CNTF; †, significantly different from IL1β; $, significantly different from respective wild-type group. Shown are caspase-3 cleavage, meant as Activate Caspase 3 (ACaspase3)/Caspase3 ratio (E) and DNA fragmentation (F) of wild-type and SOCS3kd MIN6 cells treated with citrate buffer (white bars), 1 nmol/liter CNTF (gray bars), 1 mmol/liter STZ (hatched bars), or both (black bars) (n = 4). Data are means ± S.E. *, significantly different from control; #, significantly different from CNTF; †, significantly different from STZ; $, significantly different from respective wild-type group.
FIGURE 4.
FIGURE 4.
CNTF inhibits STAT1 and promotes STAT3 phosphorylation in WT islets and cells but was unable inhibit STAT1 in SOCS3kd islets and cells. STAT1 (A) and STAT3 (B) phosphorylation of pancreatic islets from wild-type and SOCS3kd C57BL6 mice treated with citrate buffer (white bars), 0.1 mg/kg of CNTF (gray bars), 80 mg/kg of streptozotocin (hatched bars), or both (black bars) (n = 4). Data are means ± S.E. *, significantly different from control; #, significantly different from CNTF; †, significantly different from streptozotocin; $, significantly different from respective wild-type group. Shown are STAT1 (C) and STAT3 (D) phosphorylation of wild-type and SOCS3kd MIN6 cells treated with citrate buffer (white bars), 1 nmol/liter of CNTF (gray bars), 10 ng/ml of IL1β (hatched bars), or both (black bars) (n = 4). Data are means ± S.E. *, significantly different from control; #, significantly different from CNTF; †, significantly different from IL1β; $, significantly different from respective wild-type group. Shown are STAT1 (E) and STAT3 (F) phosphorylation of wild-type and SOCS3kd MIN6 cells treated with citrate buffer (white bars), 1 nmol/liter CNTF (gray bars), 1mmol/liter STZ (hatched bars), or both (black bars) (n = 4). Data are means ± S.E. *, significantly different from control; #, significantly different from CNTF; †, significantly different from STZ; $, significantly different from respective wild-type group.
FIGURE 5.
FIGURE 5.
CNTF inhibits IL1β- and STZ-induced NFκB pathway activation and iNOS expression in WT but not in SOCS3kd islets and MIN6 cells. Shown are IκB-α phosphorylation (A) and iNOS expression (B) on pancreatic islets from wild-type and SOCS3kd C57BL6 mice treated with citrate buffer (white bars), 0.1 mg/kg CNTF (gray bars), 80 mg/kg streptozotocin (hatched bars), or both (black bars) (n = 4). Data are means ± S.E. *, significantly different from control; #, significantly different from CNTF; †, significantly different from streptozotocin; $, significantly different from respective wild-type group. Shown are IκB-α phosphorylation (C) and iNOS expression (D) on wild-type and SOCS3kd MIN6 cells treated with citrate buffer (white bars), 1 nmol/liter CNTF (gray bars), 10 ng/ml IL1β (hatched bars), or both (black bars) (n = 4). Data are means ± S.E. *, significantly different from control; #, significantly different from CNTF; †, significantly different from IL1β; $, significantly different from respective wild-type group. Shown are IκB-α phosphorylation (E) and iNOS expression (F) on wild-type and SOCS3kd MIN6 cells treated with citrate buffer (white bars), 1 nmol/liter CNTF (gray bars), 1 mmol/liter STZ (hatched bars), or both (black bars) (n = 4). Data are means ± S.E. *, significantly different from control; #, significantly different from CNTF; †, significantly different from STZ; $, significantly different from respective wild-type group.
FIGURE 6.
FIGURE 6.
CNTF was unable to further protect iNOSko mice against STZ-induced diabetes. Wild-type, SOCS3kd, and iNOS−/− C57BL6 mice treated with citrate buffer (white squares), 0.1 mg/kg CNTF (black squares), 80 mg/kg streptozotocin (white triangle), or both (black triangle). Diabetes was considered when blood glucose of non-fasted mice ≥ 11.2mmol/liter for two consecutive days. Blood glucose (mmol/liter; A) and diabetes incidence (% of hyperglycemic mice; B) of wild-type and iNOSko mice.
FIGURE 7.
FIGURE 7.
CNTF effects over pathways upstream to iNOS are unchanged, but it can no longer prevent STZ-induced apoptosis on islets from iNOSko mice or MIN6 cells treated with N-Nitro-l-Arginine Methyl Ester. Shown are SOCS3 protein expression (A), STAT1 phosphorylation (B), STAT3 phosphorylation (C), IκB-α phosphorylation (D), and caspase-3 cleavage (E) of pancreatic islets from iNOSko mice. White bars, control; gray bars, CNTF; hatched bars, streptozotocin; and black bars, CNTF+streptozotocin (n = 10). Data are means ± S.E. *, significantly different from control; #, significantly different from CNTF. †, significantly different from streptozotocin. Shown are SOCS3 protein expression (F), STAT1 phosphorylation (G), STAT3 phosphorylation (H), IκB-α phosphorylation (I), and caspase-3 cleavage (J) of MIN6 cells treated with citrate buffer (white bars), 1 nmol/liter CNTF (gray bars), 1 mmol/liter STZ (hatched bars), or both (black bars) (n = 4). Data are means ± S.E. *, significantly different from control; #, significantly different from CNTF; †, significantly different from STZ; $, significantly different from respective wild-type group.
FIGURE 8.
FIGURE 8.
Proposed mechanism for CNTF protection of MIN6 β-cells in vitro against IL1β-induced apoptosis and from STZ-induced pancreatic islets apoptosis in vivo.

Similar articles

Cited by

References

    1. Gysemans C. A., Ladrière L., Callewaert H., Rasschaert J., Flamez D., Levy D. E., Matthys P., Eizirik D. L., Mathieu C. (2005) Disruption of the γ-interferon signaling pathway at the level of signal transducer and activator of transcription-1 prevents immune destruction of β-cells. Diabetes 54, 2396–2403 - PubMed
    1. Cardozo A. K., Heimberg H., Heremans Y., Leeman R., Kutlu B., Kruhøffer M., Ørntoft T., Eizirik D. L. (2001) A comprehensive analysis of cytokine-induced and nuclear factor-κB-dependent genes in primary rat pancreatic β-cells. J. Biol. Chem. 276, 48879–48886 - PubMed
    1. Eizirik D. L., Mandrup-Poulsen T. (2001) A choice of death–the signal transduction of immune-mediated β-cell apoptosis. Diabetologia 44, 2115–2133 - PubMed
    1. Cnop M., Welsh N., Jonas J. C., Jörns A., Lenzen S., Eizirik D. L. (2005) Mechanisms of pancreatic β-cell death in type 1 and type 2 diabetes: many differences, few similarities. Diabetes 54, S97–107 - PubMed
    1. Kishimoto T., Akira S., Narazaki M., Taga T. (1995) Interleukin-6 family of cytokines and gp130. Blood 86, 1243–1254 - PubMed

Publication types

MeSH terms