

Comprehensive lipidome profiling of isogenic primary and metastatic colon adenocarcinoma cell lines
- PMID: 23039336
- PMCID: PMC3491142
- DOI: 10.1021/ac302154g
Comprehensive lipidome profiling of isogenic primary and metastatic colon adenocarcinoma cell lines
Abstract
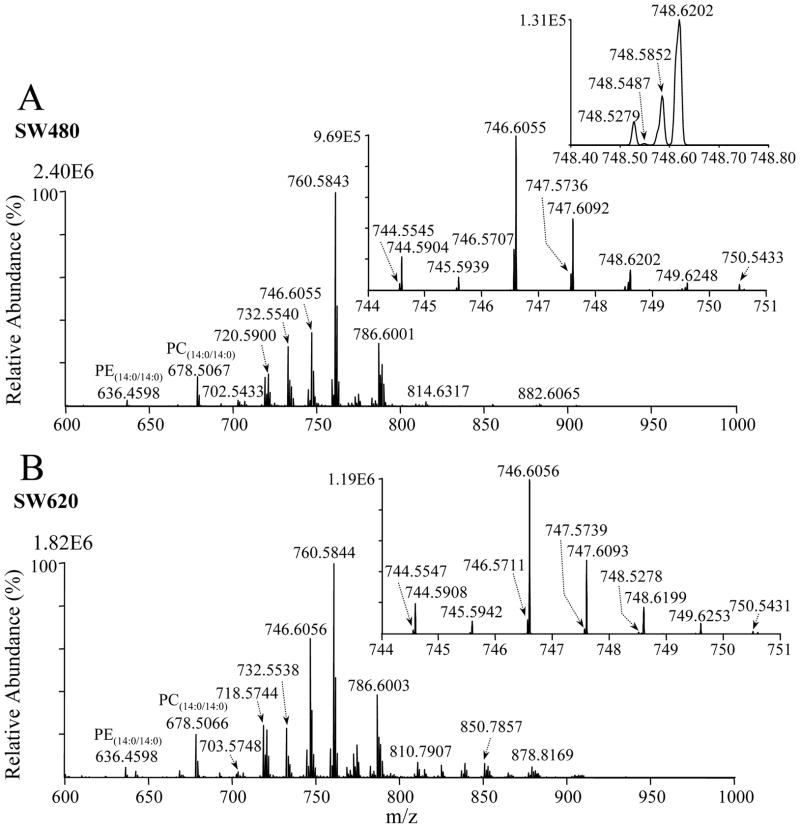
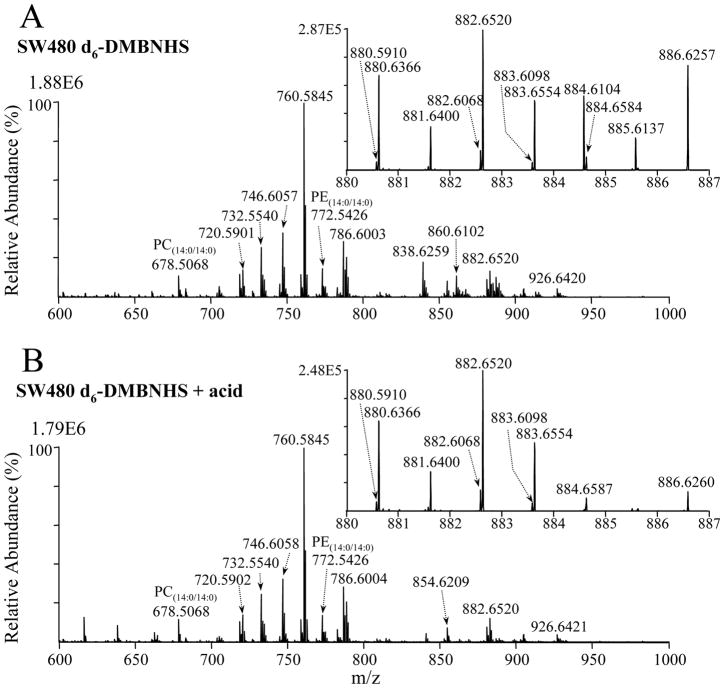
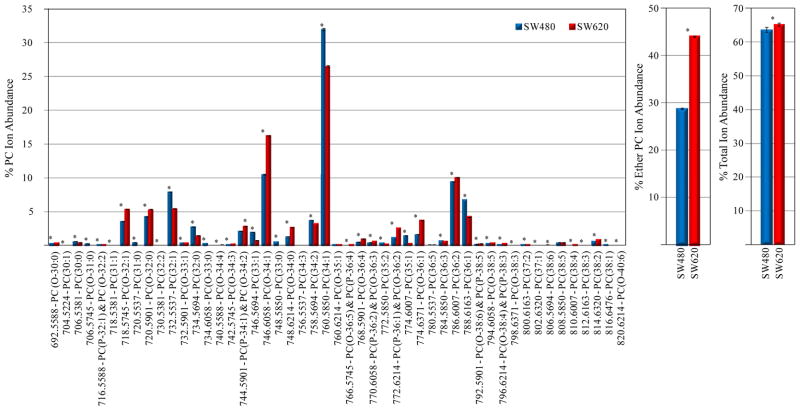
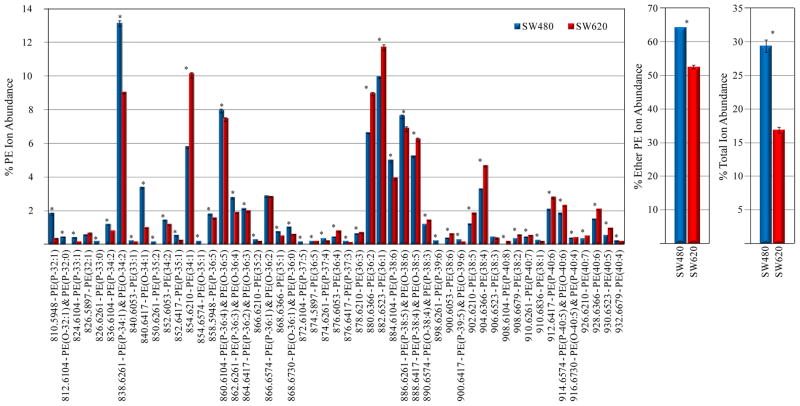
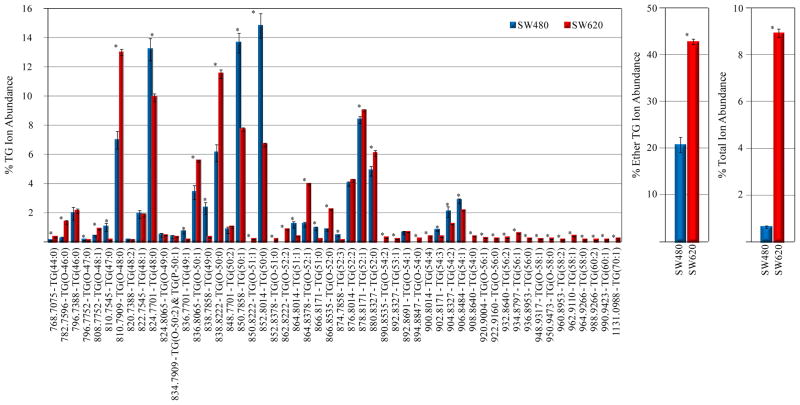
A "shotgun" lipidomics strategy consisting of sequential functional group selective chemical modification reactions coupled with high-resolution/accurate mass spectrometry and "targeted" tandem mass spectrometry (MS/MS) analysis has been developed and applied toward the comprehensive identification, characterization and quantitative analysis of changes in relative abundances of >600 individual glycerophospholipid, glycerolipid, sphingolipid and sterol lipids between a primary colorectal cancer (CRC) cell line, SW480, and its isogenic lymph node metastasized derivative, SW620. Selective chemical derivatization of glycerophosphoethanolamine and glycerophosphoserine lipids using a "fixed charge" sulfonium ion containing, d(6)-S,S'-dimethylthiobutanoylhydroxysuccinimide ester (d(6)-DMBNHS) reagent was used to eliminate the possibility of isobaric mass overlap of these species with the precursor ions of all other lipids in the crude extracts, thereby enabling their unambiguous assignment, while subsequent selective mild acid hydrolysis of plasmenyl (vinyl-ether) containing lipids using formic acid enabled these species to be readily differentiated from isobaric mass plasmanyl (alkyl-ether) containing lipids. Using this approach, statistically significant differences in the abundances of numerous lipid species previously identified as being associated with cancer progression or that play known roles as mediators in a range of physiological and pathological processes were observed between the SW480 and SW620 cells. Most notably, these included increased plasmanylcholine and triglyceride lipid levels, decreased plasmenylethanolamine lipids, decreased C-16 containing sphingomyelin and ceramide lipid levels, and a dramatic increase in the abundances of total cholesterol ester and triglyceride lipids in the SW620 cells compared to those in the SW480 cells.
Figures
References
-
- Green DE, Tzagoloff A. J Lipid Res. 1966;7:587–602. - PubMed
-
- Smith RE, Lespi P, Di Luca M, Busos C, Marra FA, de Alaniz MJT, Marra CA. Lipids. 2008;43:79–89. - PubMed
-
- Min HK, Lim S, Chung BC, Moon MH. Anal Bioanal Chem. 2011;399:823–830. - PubMed
-
- Dória ML, Cotrim Z, Macedo B, Simões C, Domingues P, Helguero L, Domingues MR. Breast Cancer Res Treat. 2012;133:635–648. - PubMed
Publication types
MeSH terms
Substances
Grants and funding
LinkOut - more resources
Full Text Sources
