. 2012 Oct 3;16(4):435-48.
doi: 10.1016/j.cmet.2012.08.010.

Human β cell transcriptome analysis uncovers lncRNAs that are tissue-specific, dynamically regulated, and abnormally expressed in type 2 diabetes

Affiliations

Human β cell transcriptome analysis uncovers lncRNAs that are tissue-specific, dynamically regulated, and abnormally expressed in type 2 diabetes

Ignasi Morán et al. Cell Metab. .

Abstract

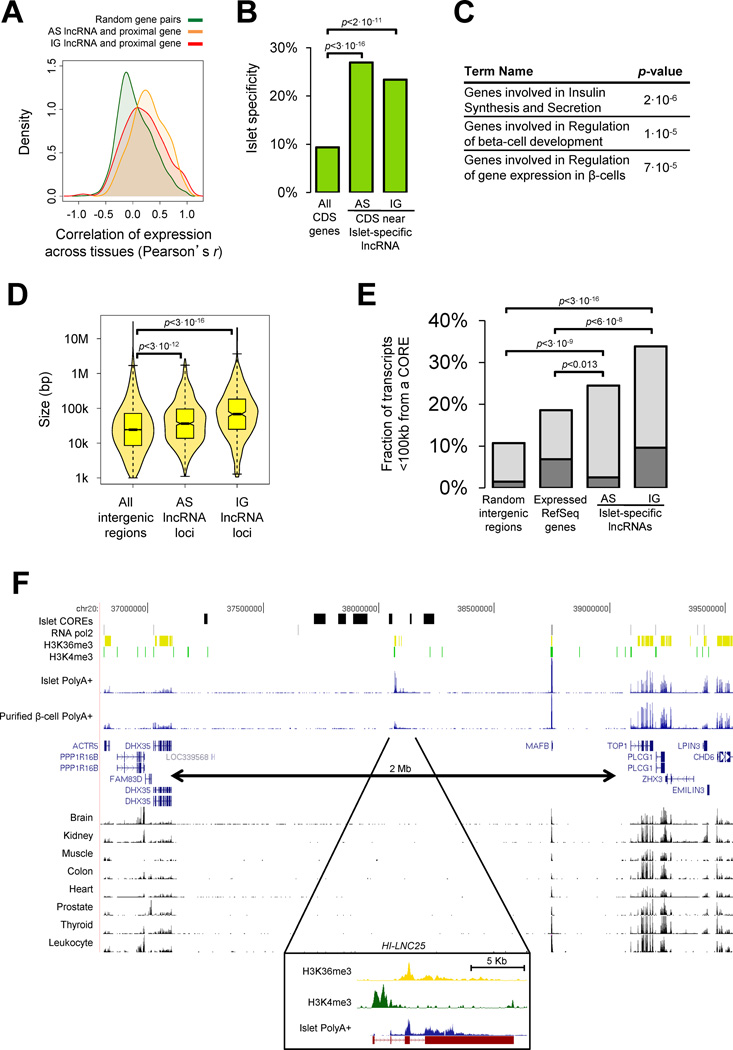
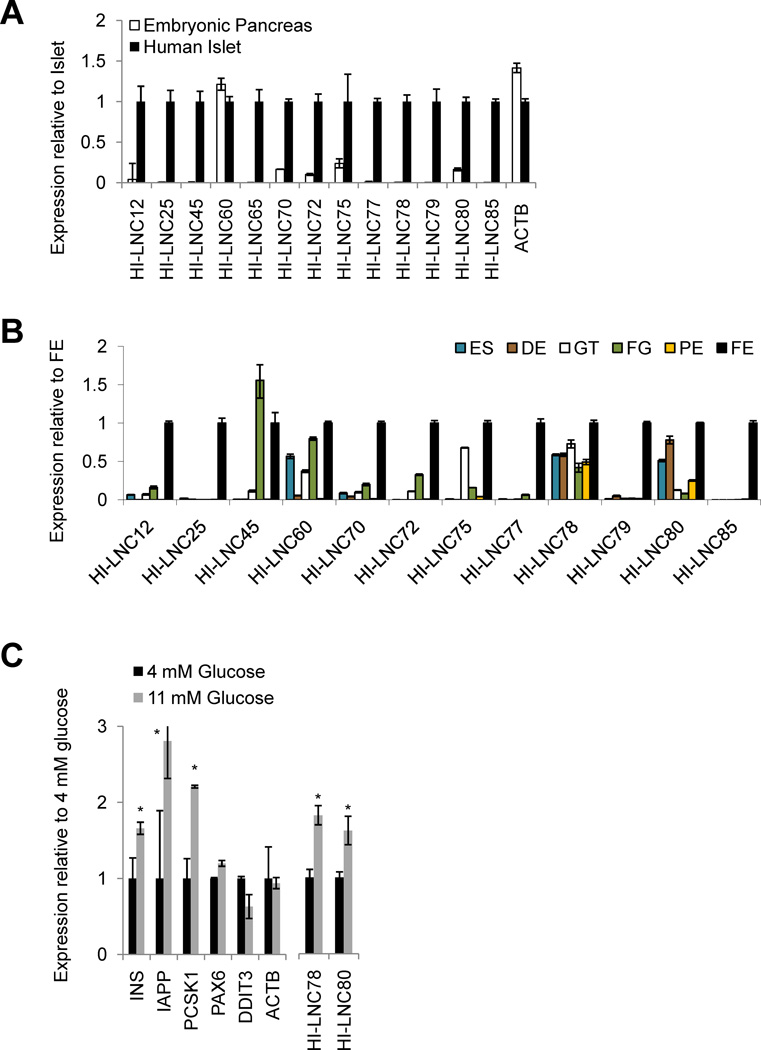
A significant portion of the genome is transcribed as long noncoding RNAs (lncRNAs), several of which are known to control gene expression. The repertoire and regulation of lncRNAs in disease-relevant tissues, however, has not been systematically explored. We report a comprehensive strand-specific transcriptome map of human pancreatic islets and β cells, and uncover >1100 intergenic and antisense islet-cell lncRNA genes. We find islet lncRNAs that are dynamically regulated and show that they are an integral component of the β cell differentiation and maturation program. We sequenced the mouse islet transcriptome and identify lncRNA orthologs that are regulated like their human counterparts. Depletion of HI-LNC25, a β cell-specific lncRNA, downregulated GLIS3 mRNA, thus exemplifying a gene regulatory function of islet lncRNAs. Finally, selected islet lncRNAs were dysregulated in type 2 diabetes or mapped to genetic loci underlying diabetes susceptibility. These findings reveal a new class of islet-cell genes relevant to β cell programming and diabetes pathophysiology.


Figures

Figure 1
Figure 1. Systematic identification of human islet and β-cell lncRNAs
(A) Outline of the analysis pipeline. (B) RNA-seq expression levels in the 3 pancreatic cell fractions for the 10 most expressed H3K4me3-positive genes in human islets. (C) Chromatin and RNA-seq landscape of the INS locus. (D) Definitions and counts of different lncRNA classes. (E) Kernel density plot of the codon substitution rate of islet lncRNAs (red), intergenic control regions (black) and randomly selected exons of protein-coding genes (green). (F) Kernel density plot of the transcriptional abundance of all RefSeq genes (green), intergenic (red) and antisense (orange) lncRNAs. The dashed line marks the 0.5 RPKM expression threshold used for defining lncRNAs. See also Figure S1 and Tables S1-S5.
Figure 2
Figure 2. Islet lncRNAs are highly tissue-specific
(A) Hierarchical clustering of expression levels of all RefSeq genes (left) and lncRNAs (right) across human islets, FACS-purified β-cells and 16 non pancreatic human tissues. Bottom panels highlight islet-specific transcripts in green. (B) Islet specificity of antisense and intergenic lncRNAs compared to all RefSeq genes. P-values were calculated by Chi-Square test. (C) Representative examples of islet-enriched lncRNAs. Gene models are depicted in red, and transcript orientation with a red arrow. All rows depict RNA-seq except the top row, which shows consistent peaks for H3K4me3 (green), H3K36 (yellow) and RNA Polymerase II (grey). The vertical axis is scaled at the same expression level for all tissues. Only 5/16 representative non-pancreatic tissues are shown for simplicity. See also Figure S2 and Table S6.
Figure 3
Figure 3. Many islet lncRNAs map near islet-specific chromatin domains and regulatory genes
(A) LncRNA transcript levels correlate with those of their nearest coding gene across tissues. Kernel density plots of correlation of RNA levels for random gene pairs (green), intergenic (IG) lncRNAs paired with their nearest coding genes (red) (p<3·10−14 compared to random genes pairs, Mann-Whitney U test), and antisense (AS) lncRNAs with their proximal coding genes (orange) (p<3·10−16). (B) Islet-specificity of all coding RefSeq genes (CDS) compared with the nearest coding RefSeq gene to islet-specific antisense and intergenic lncRNAs. P-values were calculated by Chi-square test. (C) Top enriched Gene Ontology terms for genes closest to islet-specific lncRNAs. (D) LncRNAs are preferentially located in gene-poor regions. Violin plots of the length distribution of all intergenic spaces in the genome >1kb, compared with the intergenic spaces where antisense and intergenic lncRNAs reside. (E) Percentage of islet-specific lncRNAs located near islet-specific clusters of regulatory elements (COREs), compared with random intergenic regions and RefSeq genes. Dark grey areas of the bars represent lncRNAs directly overlapping a CORE element, while light grey areas represent non-overlapping lncRNAs located <100 kb away from COREs. (F) Birds-eye view of a ~2 Mb region surrounding the islet regulator MAFB, centered on HILNC25. All rows depict RNA-seq (vertical axis fixed at 50 RPKMs), except for the first 4 rows, which show the islet CORE regions (black), enriched regions for RNA polymerase II (grey), H3K36 (yellow) and H3K4me3 (green). The bottom inset shows a zoomed-in view of the HILNC25 gene. Only 8/16 representative human tissues are shown for simplicity. See also Figure S3.
Figure 4
Figure 4. Human lncRNAs are dynamically regulated
(A) Expression of human islet-specific lncRNAs (10 intergenic, 3 antisense) was assayed in mature islets and pooled embryonic pancreas (Carnegie stage 17–19) by qPCR. The results were normalized to TBP mRNA and expressed as a fraction of expression in islets. All but one lncRNAs were activated after the pancreatic progenitor stage. (B) Human Islet lncRNAs are induced upon in vivo differentiation of embryonic stem cells. Human embryonic stem cells (ES) were subjected to a differentiation protocol that undergoes stage-specific differentiation to definitive endoderm (DE), primitive gut tube (GT), foregut endoderm (FG), and pancreatic endoderm (PE) respectively. The cells are then transplanted into mice to allow for in vivo maturation of functional endocrine cells (FE). ES, DE, GT, FG, PE and FE represent days 0, 2, 5, 7, 10 and 150 of the differentiation protocol. HI-LNC65 was not detected in any of the maturation steps and is not shown. (C) Expression of a subset of human lncRNAs is regulated by glucose. Human islets were either cultured under low (4mM) or high (11mM) glucose concentrations for 72 hrs. Panels from left to right illustrate expected glucose-responsiveness of INS, IAPP and PCSK1, and the glucose-responsiveness of HI-LNC78 and HI-LNC80 in 5 independent human islet samples. Values are normalized to TBP mRNA and expressed as a fraction of the condition denoted in the vertical axis label. Bars represent means ±SEM and asterisks denote p<0.001 (Student´s t-test).
Figure 5
Figure 5. Mouse islet lncRNA orthologs exhibit conserved regulation
(A) Mean phastCons scores for intergenic lncRNAs (red), antisense lncRNAs (orange), random intergenic fragments (black), and coding genes (green). (B) Fraction of human RefSeq exons, random intergenic regions, and lncRNAs with an orthologous mouse genomic region of at least 200 bp. (C) Fraction of orthologous regions to human RefSeq exons, random intergenic regions and lncRNAs that are transcribed higher than 0.5 RPKM in mouse islet RNA-seq. (D) qPCR confirmation in mouse islets and MIN6 mouse β-cell line for 7/7 orthologous mouse islet lncRNAs. (E) qPCR reveals islet expression of 4/7 orthologous regions where islet RNA-seq did not reveal transcription, but not in random intergenic regions. No RT denotes control reactions lacking reverse transcriptase. (F) Orthologous mouse lncRNAs are more frequently islet-specific than RefSeq genes. (G) Examples of conserved mouse islet-specific lncRNAs. Red arrows depict lncRNA orientation. The y axis for all tissues is adjusted to the same value as islets (RPKM). (H) qPCR shows that 4/7 lncRNAs were silent in E13.5 mouse embryonic pancreas and were induced in adult islets. (I) Expression of several orthologous lncRNAs is regulated by glucose. Mouse islets were cultured either under low (4mM) or high (11mM) glucose concentrations for 72 hrs. Expression is shown as a fraction of expression under low glucose conditions (n=4). All qPCR values are normalized to Tbp mRNA. Bars represent average ±SEM and asterisks denote p<0.001 (Student´s t-test). See also Figure S4 and Table S7.
Figure 6
Figure 6. Knockdown of HI-LNC25 in β-cells causes downregulation of GLIS3
(A) Human β-cells (EndoC-β-H1) were transduced with lentiviral vectors expressing two independent RNA hairpins that target HI-LNC25 RNA, or five independently transduced negative control non-targeting shRNA sequences. Cells were harvested at 7 days and assayed for GLIS3 mRNA and several control genes. (B) Effects on GLIS3 mRNA were stable 3–7 days post-transduction. Expression levels were normalized to TBP mRNA and shown as a fraction of non-targeting vector cells. The results reflect four independent experiments. Bars are average ±SEM, p-values were obtained with Student´s t-test.
Figure 7
Figure 7. Several human lncRNAs map to T2D-associated loci
(A) KCNQ1OT1 and HILNC45 are dysregulated in islets from T2D patients. Islet LncRNAs and control mRNAs were assessed by qPCR in islets isolated from 19 control and 16 T2D donors. Values are normalized to TBP mRNA and expressed as a fraction of controls. P-values represent Mann-Whitney significance test. (B) Nine T2D-associated loci contain islet lncRNAs mapping within 150kb of the reported lead SNPs. Six of these loci have been linked to β-cell dysfunction (Dupuis et al., 2010; van de Bunt and Gloyn, 2010; Voight et al., 2010). (C, D) Islet lncRNAs map to established T2D association signals located near PROX1 and WFS1. The top panel shows T2D association p-values for all analyzed SNPs in the published DIAGRAM genome wide association meta-analysis (Voight et al., 2010) and the combined p-value for the "lead" SNP after further follow-up (rs340874, p=7.2·10−10) (rs1801214, p=3.16·10−8), which are denoted as purple diamonds. SNP colors indicate LD relationships. RNA-seq and ChIP-seq is presented in the bottom panel as described in the legend for Figure 2. See also Table S8.

References

    1. Allen HL, Flanagan SE, Shaw-Smith C, De Franco E, Akerman I, Caswell R, Ferrer J, Hattersley AT, Ellard S. GATA6 haploinsufficiency causes pancreatic agenesis in humans. Nat Genet. 2012;44:20–22. - PMC - PubMed
    1. Artner I, Blanchi B, Raum JC, Guo M, Kaneko T, Cordes S, Sieweke M, Stein R. MafB is required for islet beta cell maturation. Proc Natl Acad Sci U S A. 2007;104:3853–3858. - PMC - PubMed
    1. Bell GI, Polonsky KS. Diabetes mellitus and genetically programmed defects in beta-cell function. Nature. 2001;414:788–791. - PubMed
    1. Bensellam M, Van Lommel L, Overbergh L, Schuit FC, Jonas JC. Cluster analysis of rat pancreatic islet gene mRNA levels after culture in low-, intermediate- and high-glucose concentrations. Diabetologia. 2009;52:463–476. - PubMed
    1. Bertone P, Stolc V, Royce TE, Rozowsky JS, Urban AE, Zhu X, Rinn JL, Tongprasit W, Samanta M, Weissman S, et al. Global identification of human transcribed sequences with genome tiling arrays. Science. 2004;306:2242–2246. - PubMed

Publication types