. 2012 Oct 5;91(4):660-71.
doi: 10.1016/j.ajhg.2012.08.025.

Population genetic inference from personal genome data: impact of ancestry and admixture on human genomic variation

Affiliations

Population genetic inference from personal genome data: impact of ancestry and admixture on human genomic variation

Jeffrey M Kidd et al. Am J Hum Genet. .

Abstract

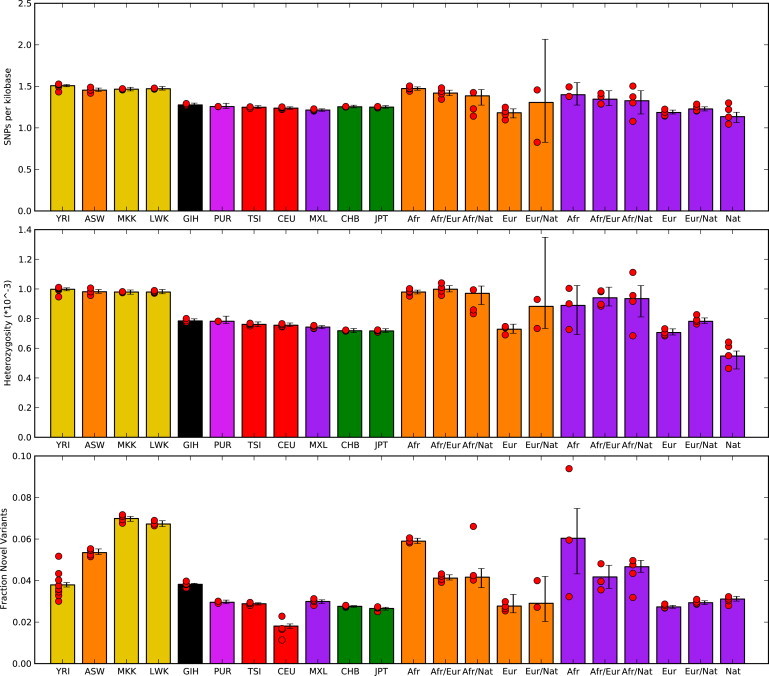
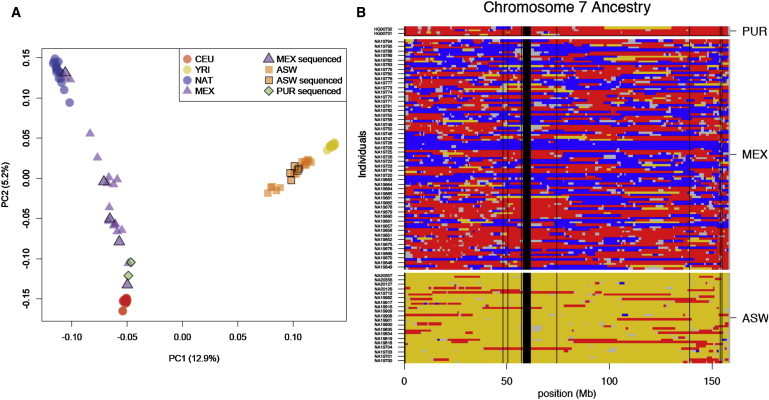
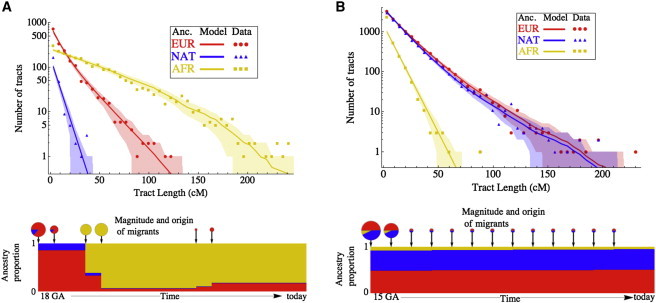
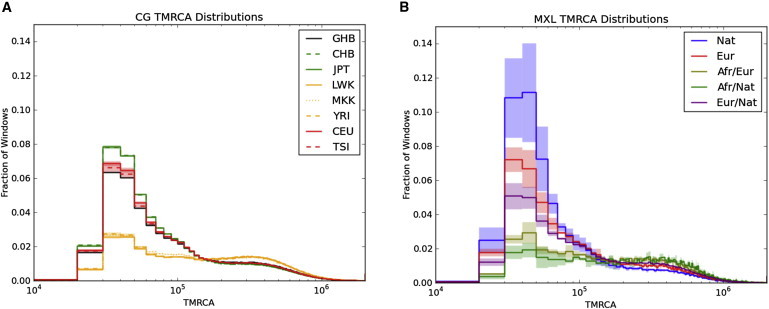
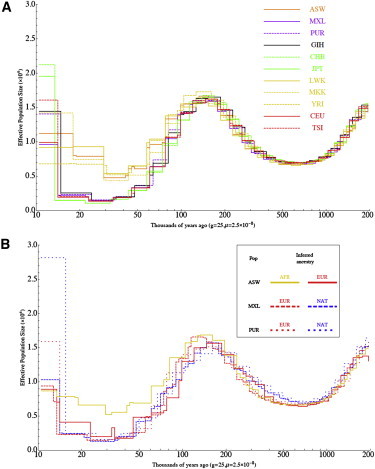
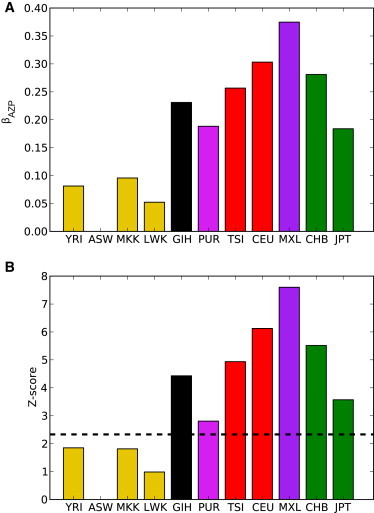
Full sequencing of individual human genomes has greatly expanded our understanding of human genetic variation and population history. Here, we present a systematic analysis of 50 human genomes from 11 diverse global populations sequenced at high coverage. Our sample includes 12 individuals who have admixed ancestry and who have varying degrees of recent (within the last 500 years) African, Native American, and European ancestry. We found over 21 million single-nucleotide variants that contribute to a 1.75-fold range in nucleotide heterozygosity across diverse human genomes. This heterozygosity ranged from a high of one heterozygous site per kilobase in west African genomes to a low of 0.57 heterozygous sites per kilobase in segments inferred to have diploid Native American ancestry from the genomes of Mexican and Puerto Rican individuals. We show evidence of all three continental ancestries in the genomes of Mexican, Puerto Rican, and African American populations, and the genome-wide statistics are highly consistent across individuals from a population once ancestry proportions have been accounted for. Using a generalized linear model, we identified subtle variations across populations in the proportion of neutral versus deleterious variation and found that genome-wide statistics vary in admixed populations even once ancestry proportions have been factored in. We further infer that multiple periods of gene flow shaped the diversity of admixed populations in the Americas-70% of the European ancestry in today's African Americans dates back to European gene flow happening only 7-8 generations ago.


Figures

Figure 1
Figure 1
Summary Statistics from Individual Sequenced Genome Individual diversity statistics are given on the basis of sequence data from Complete Genomics. In addition to mean values from each population, results partitioned by inferred local genomic ancestry are given for the ASW (African ancestry in Southwest USA) (orange bars) and MXL (Mexican ancestry in Los Angeles, California) (purple bars) populations. Only individuals with at least 1 MB of each assigned ancestry are included. Novel SNPs were determined relative to variants discovered by the 1000 Genomes low-coverage sequencing pilot and were limited to genomic positions interrogated by the project. Red circles represent mean values for each sample, and error bars represent 95% confidence intervals found by bootstrap resampling across all chromosomes from samples for each population.
Figure 2
Figure 2
Impact of Admixture on the Site Frequency Spectrum The MXL population shows more rare variants than the CEU (Utah residents with ancestry from northern and western Europe from the CEPH collection) or CHB (Han Chinese from Beijing) populations. Limiting consideration to MXL segments with inferred European ancestry (MXL 2E) removes this effect.
Figure 3
Figure 3
Local-Ancestry Inference Local genomic ancestry was inferred for the genomes of admixed individuals with the use of PCAdmix. (A) The first two principal components of variation for admixed individuals are shown relative to European, African, and Native American source populations. The markers outlined in black represent 12 admixed individuals who have been sequenced. (B) Ancestry assignment for chromosome 7. The use of phased haplotypes obtained from trios permit assignment of ancestry for each transmitted and nontransmitted chromosome separately. The following colors are used: red, inferred European ancestry; yellow, inferred African ancestry; blue, inferred Native American ancestry; gray, regions not assigned; and black, centromere and genome assembly gaps.
Figure 4
Figure 4
Inference from Admixture Tract-Length Distributions The distribution of lengths of European, African, and Native American ancestry tracts are shown for the (A) MXL and (B) ASW populations. Analysis considered parents of genotyped HapMap 3 trios. The dots indicate observed data obtained from the Viterbi local-ancestry assignment from PCAdmix. The lines and shading represent predictions and 95% confidence intervals, respectively, obtained from the models indicated. The amount and origin of gene flow are indicated by pie-chart size and coloring, and the ancestry proportion over time in the model population is illustrated below.
Figure 5
Figure 5
Distribution of Inferred TMRCA The distribution of inferred TMRCA is calculated in 10 kb windows scaled with chimpanzee divergence and is shown for (A) eight populations and (B) local ancestry in MXL. The lines indicate means, and the shading represents 95% confidence intervals for each bin determined from the samples depicted in Figure 1.
Figure 6
Figure 6
Demographic History Inferred with PSMC Estimates of effective population size over time are shown for (A) 11 populations and (B) three ancestries on the basis of local-ancestry inference in three populations with the use of PSMC, which estimates effective population sizes at different time intervals on the basis of the distribution of TMRCA estimates across the genome. Lines represent mean values obtained from separate analysis of each sample.
Figure 7
Figure 7
Interaction Coefficients Inferred for a Model of Deleterious Variant Counts Estimated values for βAZP, the interaction term representing joint effects of population ancestry, zygosity, and PolyPhen status on the counts of variants, are shown for Z = “homozygous” and p = “probably damaging” for each population. Coefficient values (A) are given relative to counts in the ASW population. Z scores of coefficient significance are given in (B). The dashed line corresponds to p = 0.01.

References

    1. International HapMap Consortium A haplotype map of the human genome. Nature. 2005;437:1299–1320. - PMC - PubMed
    1. Chakraborty R., Weiss K.M. Admixture as a tool for finding linked genes and detecting that difference from allelic association between loci. Proc. Natl. Acad. Sci. USA. 1988;85:9119–9123. - PMC - PubMed
    1. Rosenberg N.A., Huang L., Jewett E.M., Szpiech Z.A., Jankovic I., Boehnke M. Genome-wide association studies in diverse populations. Nat. Rev. Genet. 2010;11:356–366. - PMC - PubMed
    1. Lohmueller K.E., Indap A.R., Schmidt S., Boyko A.R., Hernandez R.D., Hubisz M.J., Sninsky J.J., White T.J., Sunyaev S.R., Nielsen R. Proportionally more deleterious genetic variation in European than in African populations. Nature. 2008;451:994–997. - PMC - PubMed
    1. Bustamante C.D., Burchard E.G., De la Vega F.M. Genomics for the world. Nature. 2011;475:163–165. - PMC - PubMed

Publication types