. 2012 Oct 19;37(4):660-73.
doi: 10.1016/j.immuni.2012.09.007. Epub 2012 Oct 4.

The transcription factor T-bet is induced by multiple pathways and prevents an endogenous Th2 cell program during Th1 cell responses

Affiliations

The transcription factor T-bet is induced by multiple pathways and prevents an endogenous Th2 cell program during Th1 cell responses

Jinfang Zhu et al. Immunity. .

Abstract

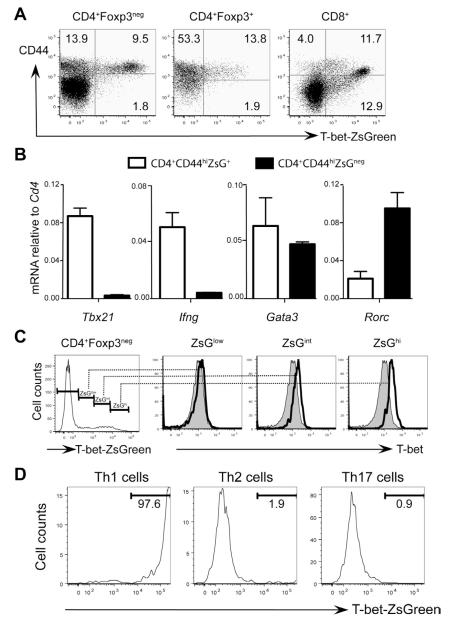
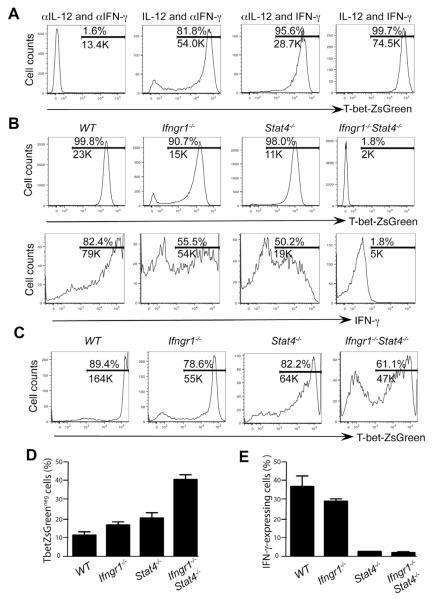
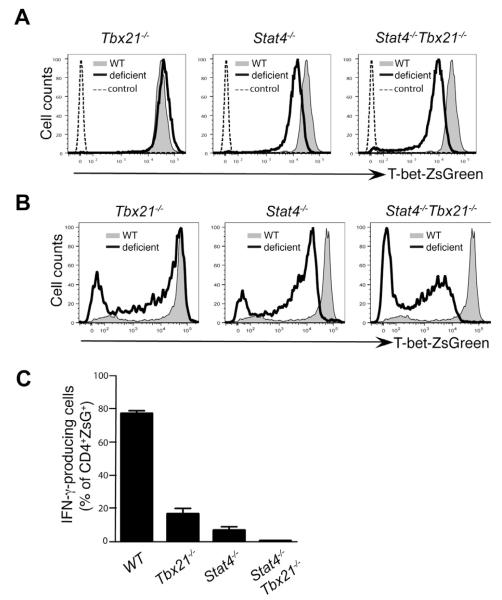
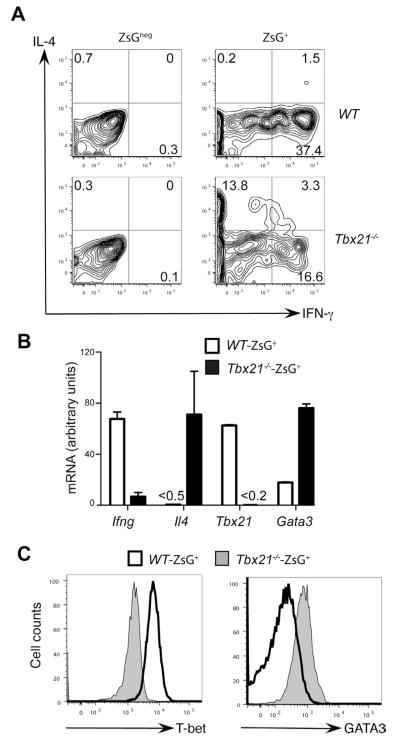
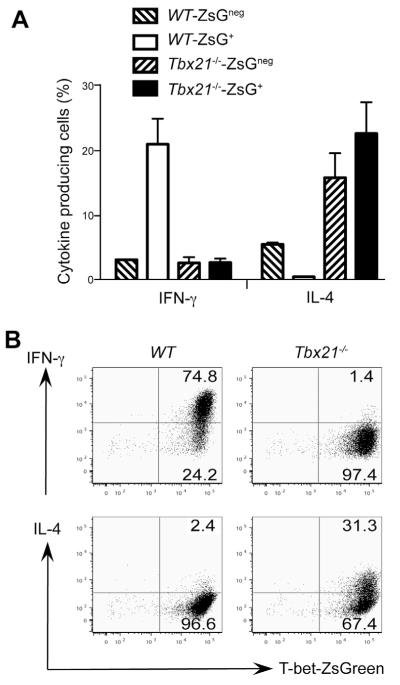
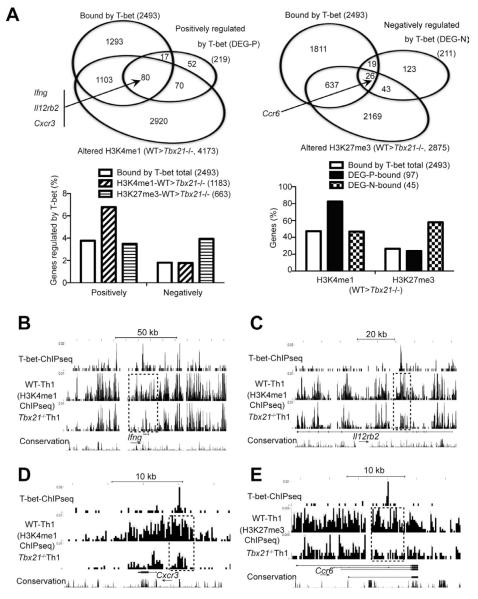
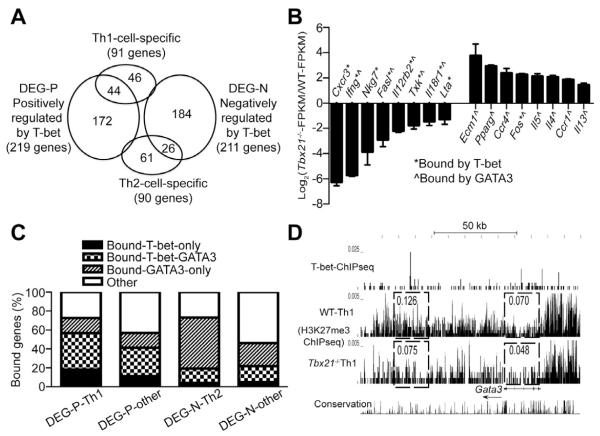
T-bet is a critical transcription factor for T helper 1 (Th1) cell differentiation. To study the regulation and functions of T-bet, we developed a T-bet-ZsGreen reporter mouse strain. We determined that interleukin-12 (IL-12) and interferon-γ (IFN-γ) were redundant in inducing T-bet in mice infected with Toxoplasma gondii and that T-bet did not contribute to its own expression when induced by IL-12 and IFN-γ. By contrast, T-bet and the transcription factor Stat4 were critical for IFN-γ production whereas IFN-γ signaling was dispensable for inducing IFN-γ. Loss of T-bet resulted in activation of an endogenous program driving Th2 cell differentiation in cells expressing T-bet-ZsGreen. Genome-wide analyses indicated that T-bet directly induced many Th1 cell-related genes but indirectly suppressed Th2 cell-related genes. Our study revealed redundancy and synergy among several Th1 cell-inducing pathways in regulating the expression of T-bet and IFN-γ, and a critical role of T-bet in suppressing an endogenous Th2 cell-associated program.


Figures

Figure 1
Figure 1. T-bet-ZsGreen reporter faithfully reflects the expression of endogenous T-bet
(A) Splenocytes of naïve TBGR mice were stained for CD4, CD8, CD44 and Foxp3. Dot plots were gated on different populations as indicated. (B) CD4+CD44hi cells from naïve TBGR mice were separated into ZsG+ and ZsGneg population by cell sorting. The relative expression amounts of different genes normalized to Cd4 were assessed by quantitative PCR after reverse transcription. (C) Splenocytes from naïve TBGR mice were stained for CD4, Foxp3 and T-bet. Histograms were gated on different populations based on ZsG intensity (low, intermediate and high) as indicated. Shaded histograms represent T-bet staining in CD4+Foxp3negZsGneg cells. (D) Sorted naïve CD62LhiCD44loCD25negZsGnegCD4+ T cells from TBGR mice were activated under Th1, Th2 or Th17 cell-polarizing conditions for 3 days. The expression of T-bet-ZsGreen was assessed by flow cytometric analysis. Numbers indicate % of cells in each quadrant or gate. Error bars represent means+SD. Data are representative of at least two independent experiments.
Figure 2
Figure 2. IL-12 and IFN-γ are redundant in inducing T-bet expression
(A) Naïve CD4+ T cells were cultured under modified Th1 cell-polarizing conditions as indicated (with anti-IL-4 included) for 3 days. (B) Naïve CD4+ T cells from various strains were cultured under Th1 cell-polarizing conditions (IL-12 and anti-IL-4) in the presence of exogenous IFN-γ for 3 days. (C-E) Various mouse strains were infected with T. gondii for 7 days. Cells harvested from spleens were characterized. The expression of T-bet-ZsGreen was assessed by flow cytomteric analysis. IFN-γ production was assessed by intracellular staining after stimulation with PMA plus ionomycin (B) or plate-bound anti-CD3 plus anti-CD28 (E) for 4 hours. Histogram plots were gated on CD4+CD44hi cells. Numbers indicate % and the MFI of the positive cells in each gate. Error bars represent means+SD. Data are representative of three (A, B) and two (C-E) independent experiments.
Figure 3
Figure 3. T-bet and Stat4 synergize in inducing IFN-γ production but T-bet does not regulate its own expression in the presence of IL-12 and IFN-γ
(A) Naïve CD4+ T cells from various strains were cultured under Th1 cell-polarizing conditions (IL-12 and anti-IL-4) in the presence of exogenous IFN-γ for 3 days. (B-C) Various mouse strains were infected with T. gondii for 7 days. Cells harvested from spleens were characterized. The expression of T-bet-ZsGreen was assessed by flow cytometric analysis. IFN-γ production was assessed by intracellular staining after stimulation with plate bound anti-CD3 plus anti-CD28 for 4 hours. Histogram plots were gated on CD4+CD44hi cells. Error bars represent means+SD. Data are representative of two independent experiments.
Figure 4
Figure 4. T-bet suppresses IL-4 and GATA3 expression during T. gondii infection
Wild type (WT) or T-bet deficient (Tbx21−/−) TBGR mice were infected with T. gondii for 7 days. Cells harvested from spleens were characterized. (A) IFN-γ and IL-4 production was assessed by intracellular staining after stimulation with plate-bound anti-CD3 plus anti-CD28 for 4 hours. Histogram plots were gated on CD4+ZsGneg and CD4+ZsG+ cells. Numbers indicate % of cells in each quadrant. (B) CD4+ZsG+ cells from were sorted. The relative expression amounts of different genes were assessed by quantitative PCR after reverse transcription. Error bars represent means+SD. (C) T-bet and GATA3 expression were assessed by intracellular staining. Histogram plots were gated on CD4+Foxp3negZsG+ cells. Data are representative of two independent experiments.
Figure 5
Figure 5. Suppression of Th2 cell-specific gene expression by T-bet is CD4+ T cell intrinsic
(A) Naive CD4+ T cells from WT and Tbx21−/− TBGR mice were sorted and transferred into Tcra−/− mice. Three weeks later, splenocytes were harvested and cytokine production was assessed by intracellular staining after PMA plus ionomycin stimulation. % of cytokine producing cells was calculated within CD4+ZsGneg and CD4+ZsG+ subsets. Error bars represent means+SD. (B) Naïve CD4+ T cells were cultured under Th1 cell-polarizing conditions (IL-12 and anti-IL-4) for 3 days. IFN-γ and IL-4 production was assessed by intracellular staining after stimulation with PMA plus ionomycin. Numbers indicate % of cells in each quadrant. Data are representative of two (A) and three (B) independent experiments.
Figure 6
Figure 6. T-bet directly regulates (either positively or negatively) many key molecules of Th1 and Th17 cells
Naïve CD4+ T cells from WT and Tbx21−/− TBGR mice were cultured under Th1 cell-polarizing conditions for 3-4 days. After resting in IL-2-containing medium for 2 days, cells were sorted for ZsG+ and further expanded under Th1 cell-polarizing conditions for another 3-4 days. Anti-T-bet and histone ChIPseq as well as RNAseq were carried out. (A) The Venn diagrams show the overlap of genes that are bound by T-bet, positively (upper left) or negatively (upper right) regulated by T-bet at a transcriptional or epigenetic level in Th1 cells. The association of histone modifications and gene regulation were determined in sub-groups of the genes that are bound by T-bet (lower panels). DEG-P and DEG-N stand for differentially expressed genes (DEG) that are regulated by T-bet positively (P) or negatively (N). (B-E) UCSC genome browser view of T-bet binding, H3K4me1 or H3K27me3 modifications at the Ifng (B), Il12rb2 (C), Cxcr3 (D) and Ccr6 (E) locus are shown. Dotted boxes indicate differences in epigenetic modifications between WT and Tbx21−/− cells around the T-bet binding sites. Arrows indicate the direction of the genes.
Figure 7
Figure 7. T-bet directly induces Th1-related genes but indirectly suppresses Th2-related genes through acting on GATA3
(A) The Venn diagram shows overlap of genes that are Th1 or Th2 cell-specific, positively or negatively regulated by T-bet in Th1 cells. (B) FPKM values were extracted from RNAseq data in duplicates. Selected Th1- and Th2 cell-specific genes were shown. “*” and “^” mark the genes that are bound by T-bet in Th1 cells and by GATA3 in Th2 cells, respectively. (C) The plots show the percentages of the genes that are bound by T-bet and/or GATA3 in each category. (D) UCSC genome browser view of T-bet binding and H3K27me3 modification at the Gata3 locus is shown. Numbers indicate the sums of RPBM (Reads Per Base Per Million reads in library) values in the box. Arrow indicates the direction of the Gata3 gene.

Comment in

  • New tricks from an old master.
    Murphy KM. Murphy KM. Immunity. 2012 Oct 19;37(4):591-3. doi: 10.1016/j.immuni.2012.10.004. Immunity. 2012. PMID: 23084353 Free PMC article.

References

    1. Afkarian M, Sedy JR, Yang J, Jacobson NG, Cereb N, Yang SY, Murphy TL, Murphy KM. T-bet is a STAT1-induced regulator of IL-12R expression in naive CD4+ T cells. Nat. Immunol. 2002;3:549–557. - PubMed
    1. Ansel KM, Djuretic I, Tanasa B, Rao A. Regulation of Th2 differentiation and Il4 locus accessibility. Annu. Rev. Immunol. 2006;24:607–656. - PubMed
    1. Barski A, Cuddapah S, Cui K, Roh TY, Schones DE, Wang Z, Wei G, Chepelev I, Zhao K. High-resolution profiling of histone methylations in the human genome. Cell. 2007;129:823–837. - PubMed
    1. Cote-Sierra J, Foucras G, Guo L, Chiodetti L, Young HA, Hu-Li J, Zhu J, Paul WE. Interleukin 2 plays a central role in Th2 differentiation. Proc. Natl. Acad. Sci. USA. 2004;101:3880–3885. - PMC - PubMed
    1. Finkelman FD, Morris SC, Orekhova T, Mori M, Donaldson D, Reiner SL, Reilly NL, Schopf L, Urban JF., Jr. Stat6 regulation of in vivo IL-4 responses. J. Immunol. 2000;164:2303–2310. - PubMed

Publication types

Associated data