. 2012 Nov 6;22(21):2081-5.
doi: 10.1016/j.cub.2012.09.014. Epub 2012 Oct 4.

The retinotopic organization of striate cortex is well predicted by surface topology

Affiliations

The retinotopic organization of striate cortex is well predicted by surface topology

Noah C Benson et al. Curr Biol. .

Erratum in

  • Curr Biol. 2012 Dec 4;22(23):2284

Abstract

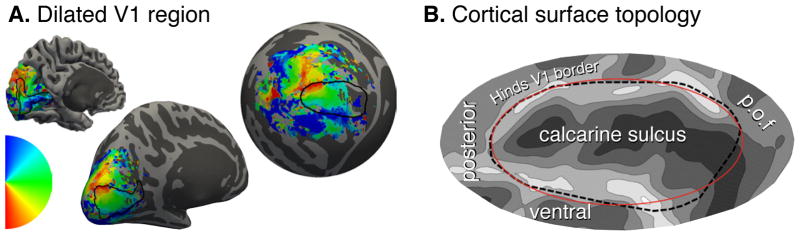
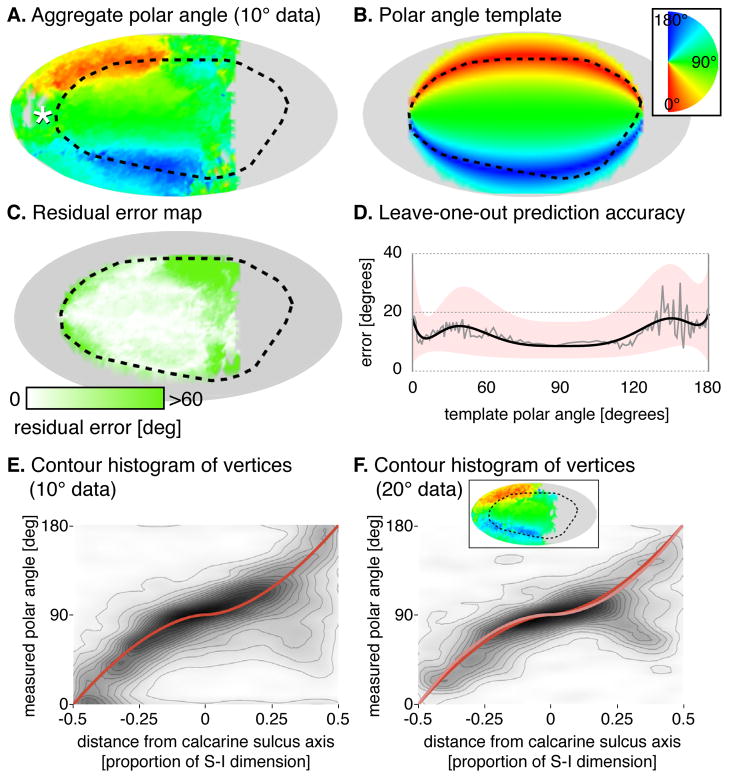
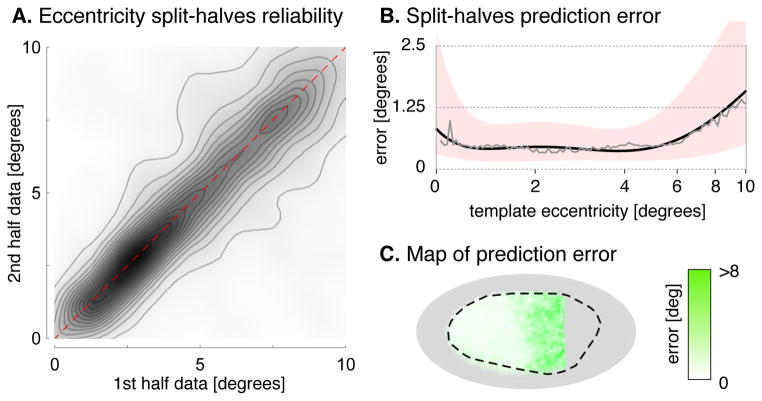
In 1918, Gordon Holmes combined observations of visual-field scotomas across brain-lesioned soldiers to produce a schematic map of the projection of the visual field upon the striate cortex. One limit to the precision of his result, and the mapping of anatomy to retinotopy generally, is the substantial individual variation in the size, volumetric position, and cortical magnification of area V1. When viewed within the context of the curvature of the cortical surface, however, the boundaries of striate cortex fall at a consistent location across individuals. We asked whether the surface topology of the human brain can be used to accurately predict the internal, retinotopic function of striate cortex as well. We used fMRI to measure polar angle and eccentricity in 25 participants and combined their maps within a left-right, transform-symmetric representation of the cortical surface. These data were then fit using a deterministic, algebraic model of visual-field representation. We found that an anatomical image alone can be used to predict the retinotopic organization of striate cortex for an individual with accuracy equivalent to 10-25 min of functional mapping. This indicates tight developmental linkage of structure and function within a primary, sensory cortical area.


Figures

Fig. 1
Fig. 1. Cortical surface atlas space
(A) Polar angle assignment is plotted on the folded (left), inflated (center), and spherical (right) hemisphere of a single subject. The black line shows the Hinds et al. [6] V1 outline throughout. (B) Cortical folding and landmarks around area V1. The calcarine sulcus, and parieto-occipital fissure (p.o.f.) are indicated. The red ellipse defines the border of the algebraic template. Fig. S1 illustrates the projection of the visual field onto this patch of cortex.
Fig. 2
Fig. 2. Polar angle prediction
(A) Aggregate polar angle data of 18 of the 19 subjects shown visual stimuli within 10° of fixation (one significant outlier excluded). White asterisk is the foveal confluence; black dotted line is the Hinds et al. V1 border [6]. (B) Algebraic template, fit to the aggregate polar angle map. (C) Absolute residual error between the template fit and aggregate data. (D) Median absolute prediction error across vertices and subjects by template polar angle. The median error (grey), is fit by a fifth-order polynomial (black) with the similarly fit upper and lower quartiles defining the border of the pink region. (E) Contour histogram of all vertices from 10° dataset subjects, binned by measured polar angle and superior-inferior position in the template space. The template fit is shown in red. Each contour line corresponds to ~2,000 vertices. (F) Corresponding contour histogram from 20° dataset subjects. The template fit to the 20° dataset is in pink, and the fit to the 10° dataset is reproduced from Fig 2E in red. Each contour line corresponds to ~700 vertices. Inset is the aggregate map for the 20° dataset. Fig. S2A presents the polar angle aggregates and fits by hemisphere, and Table S1 provides the exact formulae measurements.
Fig. 3
Fig. 3. Eccentricity prediction
(A) Aggregate eccentricity data of subjects (n = 19) shown visual stimuli within 10° of fixation. White asterisk is the foveal confluence; black dotted line is the Hinds et al. V1 border [6]. (B) Algebraic model, fit to the aggregate eccentricity map, after excluding those points with values ≤2.5° and ≥8°. (C) Absolute residual error between the template fit and aggregate data. (D) Median absolute prediction error across vertices and subjects by template eccentricity. The median error (grey), is fit by a fifth-order polynomial (black) with the similarly fit upper and lower quartiles defining the border of the pink region. (E) Contour histogram of all vertices from 10° dataset subjects, binned by measured eccentricity and posterior-anterior position in the template space. The exponential template fit is shown in red. Each contour line corresponds to ~2,000 vertices. (F) Corresponding contour histogram from 20° dataset subjects. The template fit to the 20° dataset is in pink, and the fit to the 10° dataset is reproduced from Fig 2E in red. Each contour line corresponds to ~800 vertices. Inset is the aggregate map for the 20° dataset. Fig. S2B presents the polar angle aggregates and fits by hemisphere, and Table S1 provides the exact formulae measurements.
Fig. 4
Fig. 4. Split-halves reliability of eccentricity
(A) A split-halves analysis plotted the eccentricity measured for each vertex for each subject from the first half of each ~30 minute scan against the eccentricity derived from the same vertex during the second half-scan. Each contour line corresponds to ~4,100 vertices (B) Median absolute split-halves error across vertices and subjects by template eccentricity. The median error (grey), is fit by a fifth-order polynomial (black) with the similarly fit upper and lower quartiles defining the border of the pink region. (C) Test-retest absolute residuals between first- and second-half measurements for each vertex shown on the cortical surface. Fig. S3 presents the corresponding measurements for polar angle.

Comment in

References

    1. Holmes G. Disturbances of visual orientation. Br J Ophthalmol. 1918;2(9):449–468. - PMC - PubMed
    1. Andrews TJ, Halpern SD, Purves D. Correlated size variations in human visual cortex, lateral geniculate nucleus, and optic tract. J Neurosci. 1997;17(8):2859–2868. - PMC - PubMed
    1. Dougherty RF, Koch VM, Brewer AA, Fischer B, Modersitzki J, Wandell BA. Visual field representations and locations of visual areas V1/2/3 in human visual cortex. J Vis. 2003;3(10):586–598. - PubMed
    1. Amunts K, Malikovic A, Mohlberg H, Schormann T, Zilles K. Brodmann’s areas 17 and 18 brought into stereotaxic space-where and how variable? NeuroImage. 2000;11(1):66–84. - PubMed
    1. Qiu A, Rosenau BJ, Greenberg AS, Hurdal MK, Barta P, Yantis S, Miller MI. Estimating linear cortical magnification in human primary visual cortex via dynamic programming. NeuroImage. 2006;31(1):125–138. - PubMed

Publication types

LinkOut - more resources