. 2012 Nov 9;48(3):471-84.
doi: 10.1016/j.molcel.2012.08.031. Epub 2012 Oct 4.

Gene density, transcription, and insulators contribute to the partition of the Drosophila genome into physical domains

Affiliations

Gene density, transcription, and insulators contribute to the partition of the Drosophila genome into physical domains

Chunhui Hou et al. Mol Cell. .

Abstract

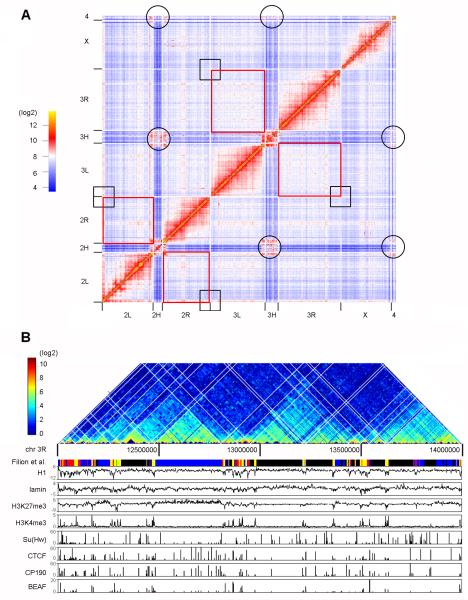
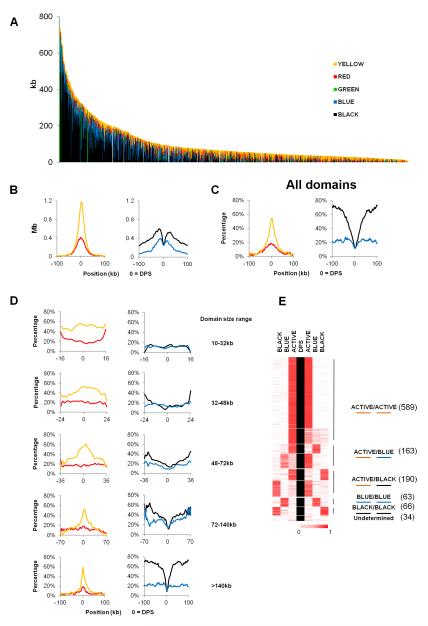
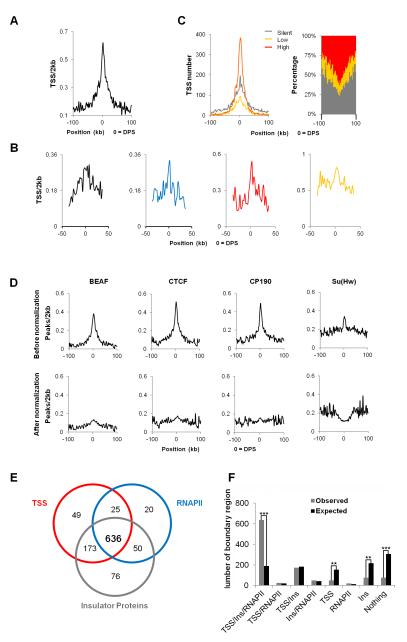
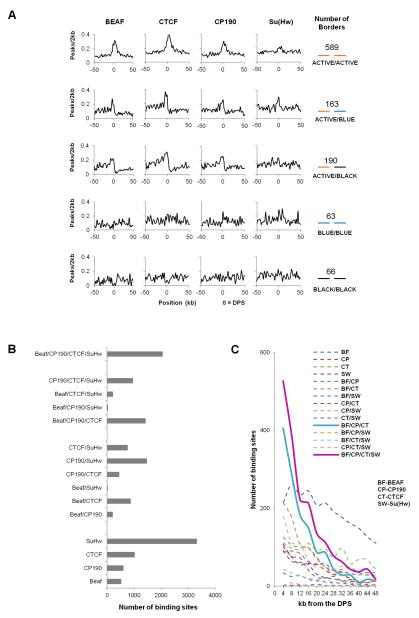
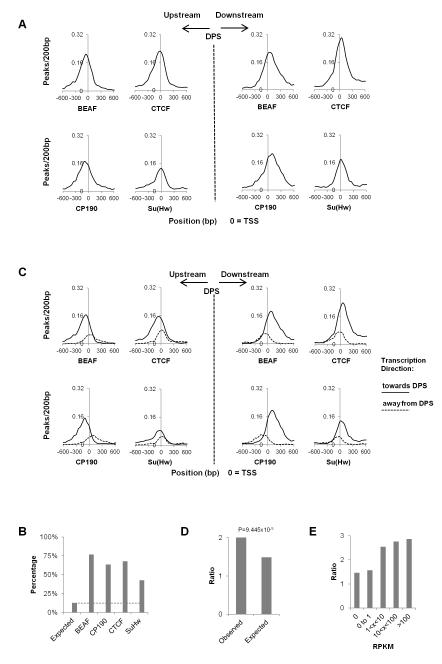
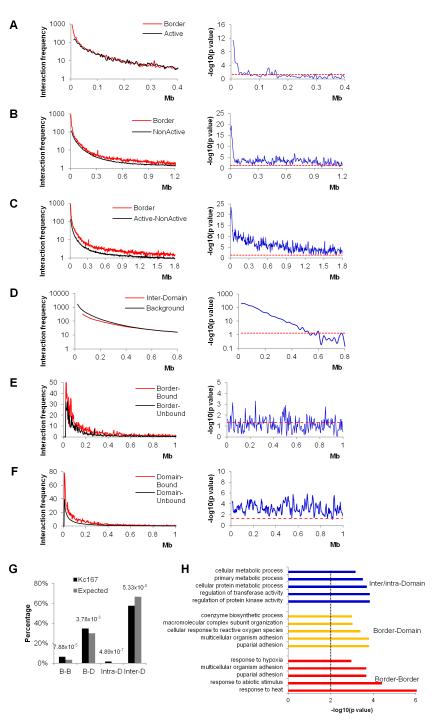
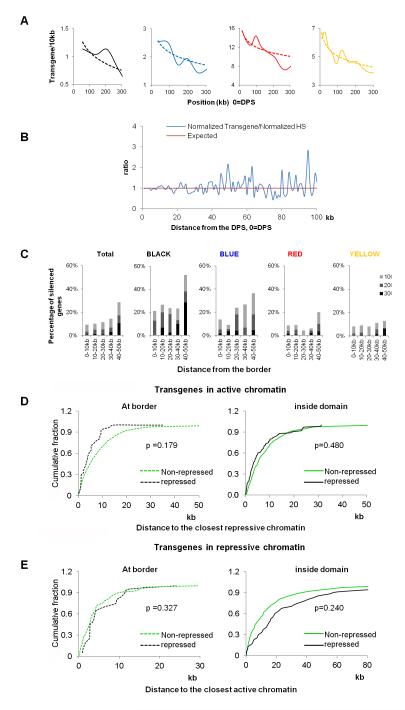
The mechanisms responsible for the establishment of physical domains in metazoan chromosomes are poorly understood. Here we find that physical domains in Drosophila chromosomes are demarcated at regions of active transcription and high gene density that are enriched for transcription factors and specific combinations of insulator proteins. Physical domains contain different types of chromatin defined by the presence of specific proteins and epigenetic marks, with active chromatin preferentially located at the borders and silenced chromatin in the interior. Domain boundaries participate in long-range interactions that may contribute to the clustering of regions of active or silenced chromatin in the nucleus. Analysis of transgenes suggests that chromatin is more accessible and permissive to transcription at the borders than inside domains, independent of the presence of active or silencing histone modifications. These results suggest that the higher-order physical organization of chromatin may impose an additional level of regulation over classical epigenetic marks.


Figures

Figure 1
Figure 1. Partition of the Drosophila Genome into Physical Domains
(A) Genome-wide interaction heat map at 100 kb resolution for the Drosophila genome in Kc167 cells. Black circles and squares show interactions between centromeres and telomeres, respectively. Red rectangles show interactions between chromosome arms 2L-2R and 3L-3R, respectively. (B) Hi-C interaction frequencies displayed as a two-dimensional heat map at single fragment resolution for a 2 Mb region of chromosome 3R alongside with selected epigenetic marks and chromatin types defined by the presence of various proteins and histone modifications. The white grid on the heat map shows where the domains are partitioned.
Figure 2
Figure 2. Physical Domain Boundaries Are Preferentially Formed in Regions of Active Chromatin
(A) Size distribution of chromatin types within each physical domain. Domains are arranged in order of size, from largest (left) to smallest (right). Chromatin types (Filion et al., 2010) within domains are arranged in the order of BLACK, BLUE, GREEN, RED and YELLOW from the bottom to the top. (B) Distribution of chromatin size for aligned domains in 2 kb windows surrounding domain partition sites (DPSs). Sizes of total chromatin (left), active chromatin types (middle) and repressive chromatin types (right) are shown. (C) Percentage of active (RED and YELLOW) and repressive (BLUE and BLACK) chromatin surrounding DPSs for all domains. Total size of each chromatin type within each 2 kb window was divided by the total size of all chromatin in that window to obtain the percentage values. (D) Percentage of each chromatin type surrounding DPSs for domains of different sizes (10-32, 32-48, 48-72, 72-140 and ≥140 kb) calculated as described in (C). (E) Five groups of physical domain borders identified by clustering the percentages of ACTIVE (YELLOW & RED), BLUE and BLACK chromatin types within the first 4 kb bins flanking DPSs for each border. Borders showing similar chromatin contents are clustered and symmetrical clusters are grouped. The number of each border found in each group is listed on the right.
Figure 3
Figure 3. Domain Borders are Located in Gene-dense Regions
(A) TSS density surrounding DPSs in Kc167 cells. Total number of TSSs in each 2 kb window flanking aligned DPSs were counted and divided by the total chromatin size in the same window. (B) TSS density in each specific chromatin type surrounding DPSs calculated as described in (A) but only TSSs within each specific chromatin in a 2 kb window were used. (C) Expression levels of genes surrounding DPSs. Absolute gene numbers are shown in the left panel within 2 kb windows and the percentage of genes at each expression level is shown in the right panel. (D) Insulator protein enrichment surrounding DPSs before (upper panel) and after (lower panel) normalization against TSSs density. (E) Venn diagram showing the number of DPSs with a given mark (TSSs, RNAPII or insulator proteins) within a +/−4 kb window surrounding DPSs. There are 76 DPSs without any of these three marks. (F) Number of DPSs associated with a given mark (TSSs, RNAPII or insulator proteins) for observed (grey bars) and the expected (black bars) boundary regions. Statistically significant differences in the comparisons are indicated by double asterisk (**) (p < 1.00E-15) and triple asterisks (***) (p < 1.00E-80), respectively (Fisher’s exact test).
Figure 4
Figure 4. Specific Combinations of Insulator Proteins are Present at Domain Boundary Regions
(A) Single insulator protein enrichment surrounding DPSs at five groups of clustered domain borders. In each 2 kb window, total peaks for each insulator protein were counted and divided by the fraction of each chromatin type present in that window for each group of aligned borders. (B) Number of single insulator protein sites an various protein combinations in 100 kb regions upstream and downstream of DPSs. (C) Distribution of single insulator protein sites and various protein combinations in 4kb windows over a 48 kb region from DPSs.
Figure 5
Figure 5. Gene Orientation Bias at Domain Boundary Regions
(A) Enrichment of insulator protein peaks surrounding the TSSs of the genes on both sides and immediate adjacent to the DPSs. TSSs are aligned with the gene orientation unaltered. (B) Percentage of total insulator protein peaks present in boundary regions (DPSs +/− 4kb) and located within +/−0.5 kb from TSSs. (C) Enrichment of insulator proteins surrounding the aligned TSSs of the genes adjacent to and on either side of the DPSs. (D) Ratios between the genes adjacent to the DPSs transcribed toward and away from the DPSs for identified and randomly created domains (p < 1.00×10⁻⁴, Fisher’s exact test). (E) Ratios between the genes adjacent to the DPSs transcribed toward and away from the DPSs with different expression levels.
Figure 6
Figure 6. Long-range Interactions among Domain Boundaries
(A) Interaction frequencies between boundary regions (Border, red line) compared to the genomic background active chromatin (Active, black line) are shown in the left panel. The right panel shows the p values for each distance examined (Wilcoxon test) with the red dashed line representing a p value of 0.05. (B) Interaction frequencies between boundary regions (Border, red line) compared to the genomic background inactive chromatin (Non-active, black line) in the left panel. The right panel is as in (A). (C) Interaction frequencies between boundary regions (Border, red line) compared to the genomic background active-inactive chromatin (Active-Non-active) in the left panel. The right panel is as in (A). (D) Interaction frequencies between domain bins (Inter-Domain, red) compared to genomic background (Background, black) in the left panel. The right panel is as in (A). (E) Interaction frequencies between fragments at boundary regions associated with BEAF, CTCF, CP190 and RNAPII simultaneously (Border-Bound, red) compared to fragments at boundary regions without the simultaneous binding of the four proteins (Border-Unbound, black). The right panel is as in (A). (F) Interaction frequencies between fragments located inside of two different domains. Fragments associated with BEAF, CTCF, CP190 and RNAPII simultaneously (Domain-Bound, red) are compared to fragments without the simultaneous binding of the four proteins (Domain-Unbound, black). The right panel is as in (A). (G) Percentage of interactions between boundary regions (B-B), boundary region and domain internal regions (B-D), inside domain (Intra-D) and between domains (Inter-D) identified at 20 kb resolution (black bars, Kc167). The same number interactions with the same size distribution as those identified experimentally were randomly created for each chromosome arm and reiterated 1000 times as a control (grey bars). (H) Gene ontology analysis of genes involved in the interactions between Border-Border (red bars), Border-Domain (yellow bars) and Inter/intra-Domain (blue bars). The black dashed line indicates p=0.01.
Figure 7
Figure 7. Analysis of Transgene Insertion and Expression in Physical Domains
(A) Transgene insertion rates in each chromatin type relative to DPSs. The insertion rates were calculated by dividing the total transgene number in each chromatin type present in bins containing the same size of each specific chromatin. (B) Two step normalization of insertion rate for transgenes against DNaseI hypersensitive sites (HS) density relative to the DPS. (C) Percentage of transgenes repressed at different levels in 10 kb bins from DPSs in all domains (Total) and in domains containing various chromatin types. (D) Cumulative percentage of transgene distribution relative to the closest repressive chromatin type. Transgenes repressed and non-repressed at borders are shown in the left panel and those repressed and non-repressed inside domains are shown on the right. Statistical significance was calculated using the Kolmogorov-Smirnov test (KS-test). (E) Cumulative percentage of transgenes in repressive chromatin types relative to the closest active chromatin type. Transgenes distribution and statistical significance are plotted and calculated as in (D).

Comment in

  • Order from chaos in the nucleus.
    Xu Z, Felsenfeld G. Xu Z, et al. Mol Cell. 2012 Nov 9;48(3):327-8. doi: 10.1016/j.molcel.2012.10.021. Mol Cell. 2012. PMID: 23141201 Free PMC article.

References

    1. Babenko VN, Makunin IV, Brusentsova IV, Belyaeva ES, Maksimov DA, Belyakin SN, Maroy P, Vasil’eva LA, Zhimulev IF. Paucity and preferential suppression of transgenes in late replication domains of the D. melanogaster genome. BMC Genomics. 2010;11:318. - PMC - PubMed
    1. Bantignies F, Roure V, Comet I, Leblanc B, Schuettengruber B, Bonnet J, Tixier V, Mas A, Cavalli G. Polycomb-dependent regulatory contacts between distant Hox loci in Drosophila. Cell. 2011;144:214–226. - PubMed
    1. Bau D, Sanyal A, Lajoie BR, Capriotti E, Byron M, Lawrence JB, Dekker J, Marti-Renom MA. The three-dimensional folding of the alpha-globin gene domain reveals formation of chromatin globules. Nat Struct Mol Biol. 2011;18:107–114. - PMC - PubMed
    1. Bellen HJ, Levis RW, He Y, Carlson JW, Evans-Holm M, Bae E, Kim J, Metaxakis A, Savakis C, Schulze KL, et al. The Drosophila gene disruption project: progress using transposons with distinctive site specificities. Genetics. 2011;188:731–743. - PMC - PubMed
    1. Bian Q, Belmont AS. Revisiting higher-order and large-scale chromatin organization. Curr Opin Cell Biol. 2012 - PMC - PubMed

Publication types

Associated data