. 2012 Oct 25;2(4):756-65.
doi: 10.1016/j.celrep.2012.08.029. Epub 2012 Oct 4.

Developmental plasticity is bound by pluripotency and the Fgf and Wnt signaling pathways

Affiliations

Developmental plasticity is bound by pluripotency and the Fgf and Wnt signaling pathways

Samantha A Morris et al. Cell Rep. .

Abstract

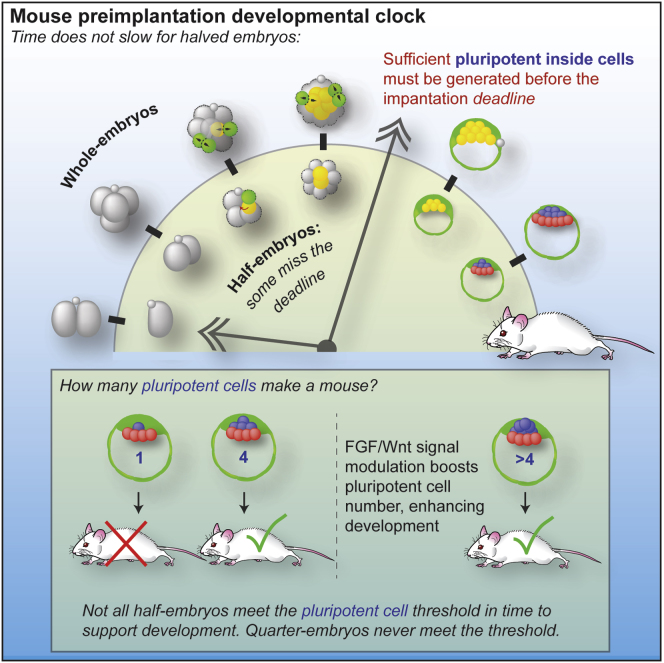
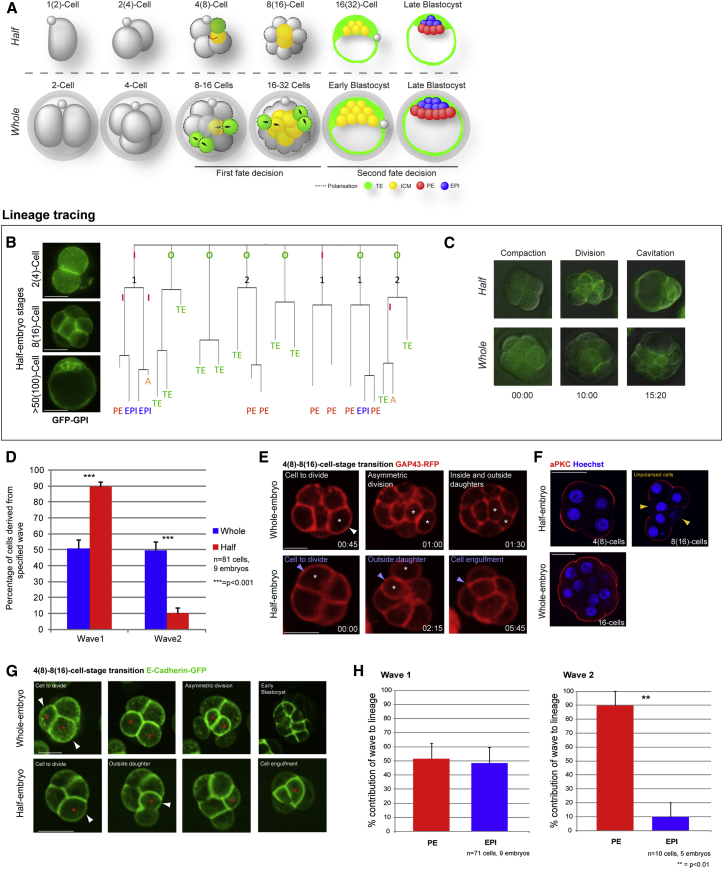
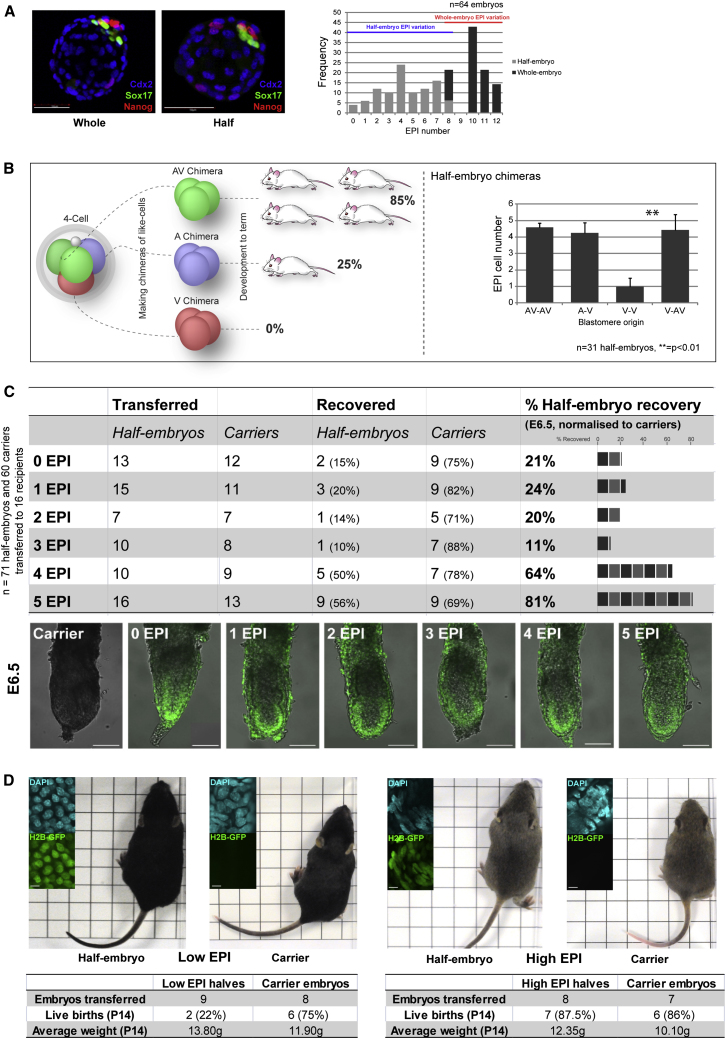
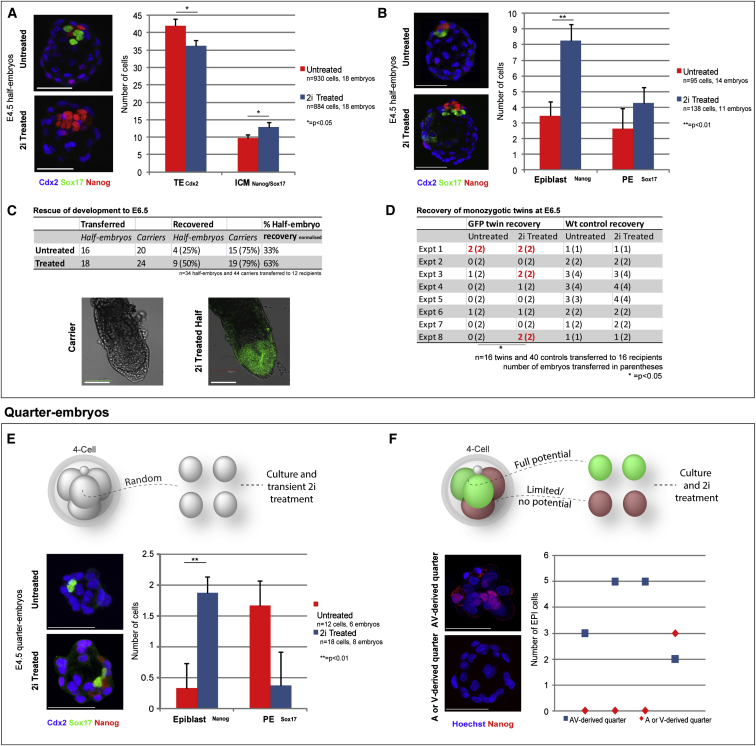
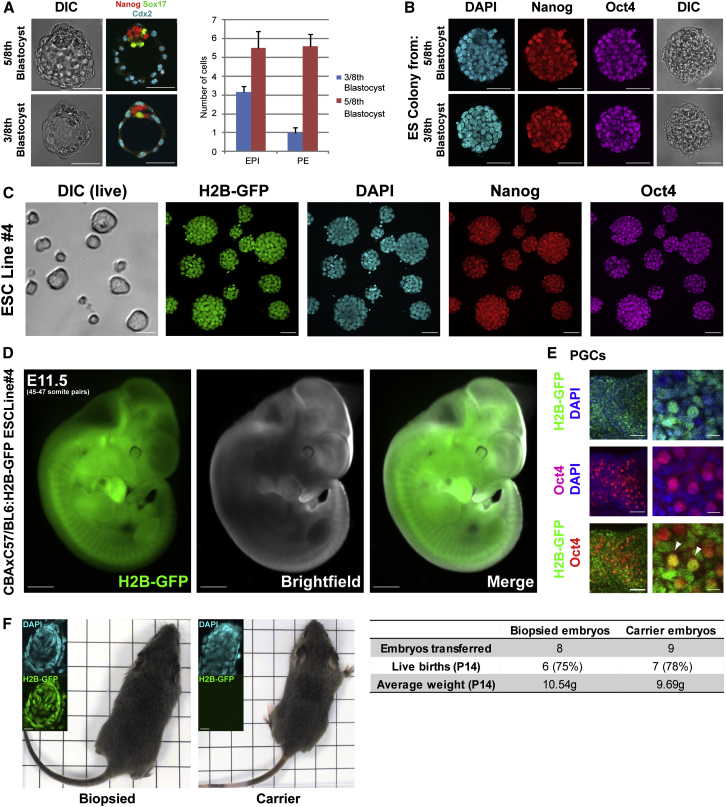
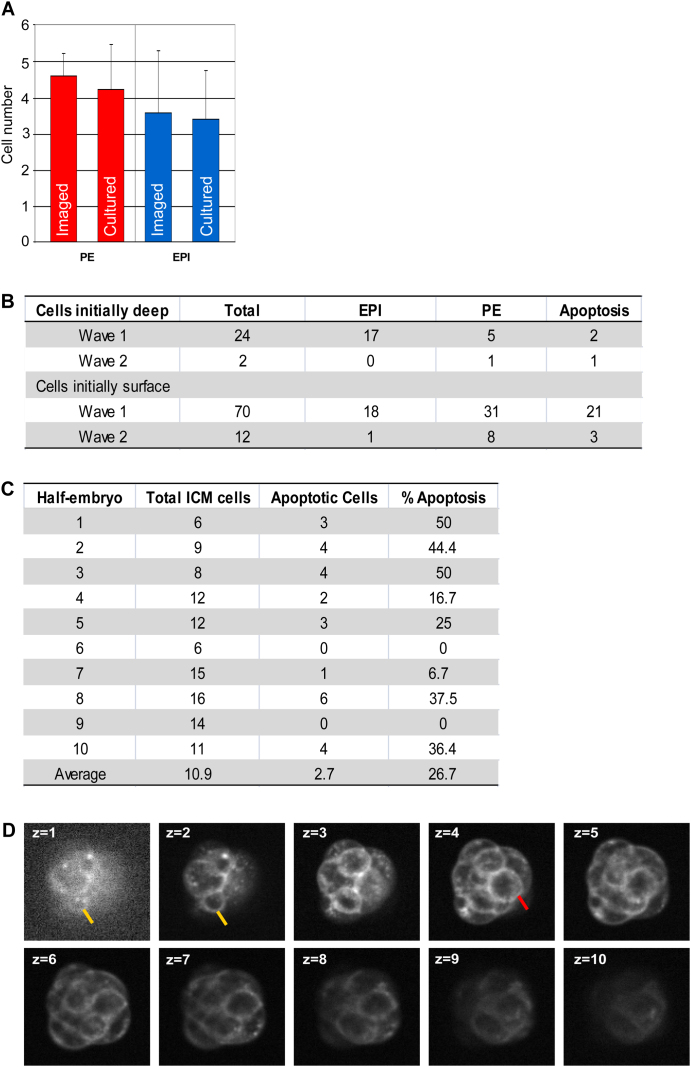
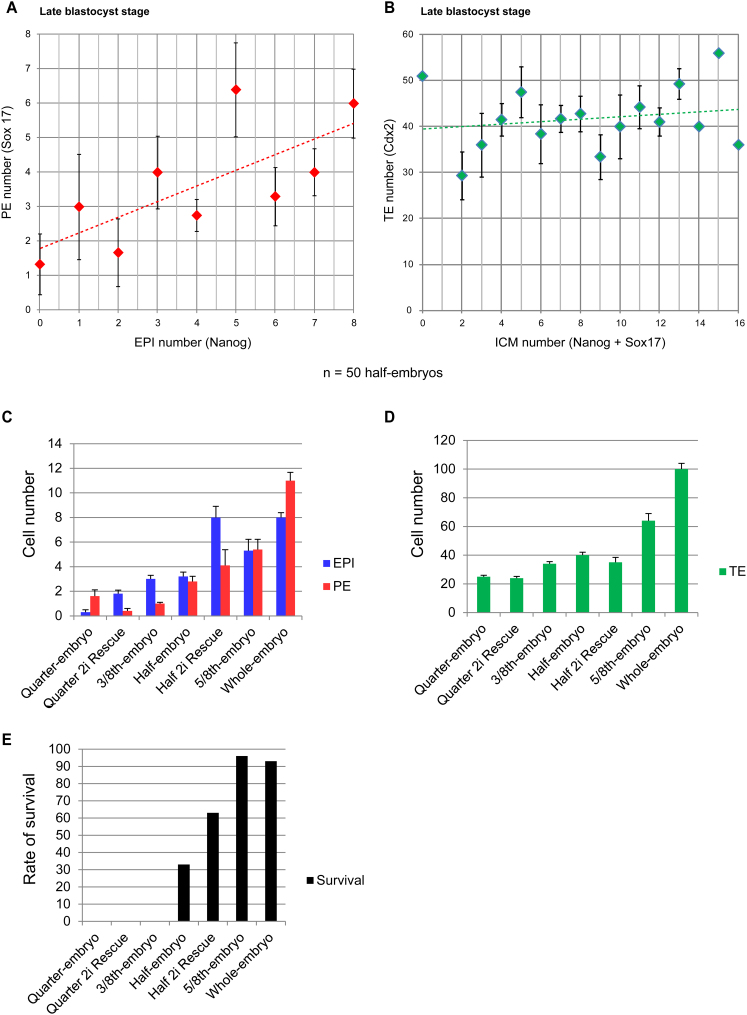
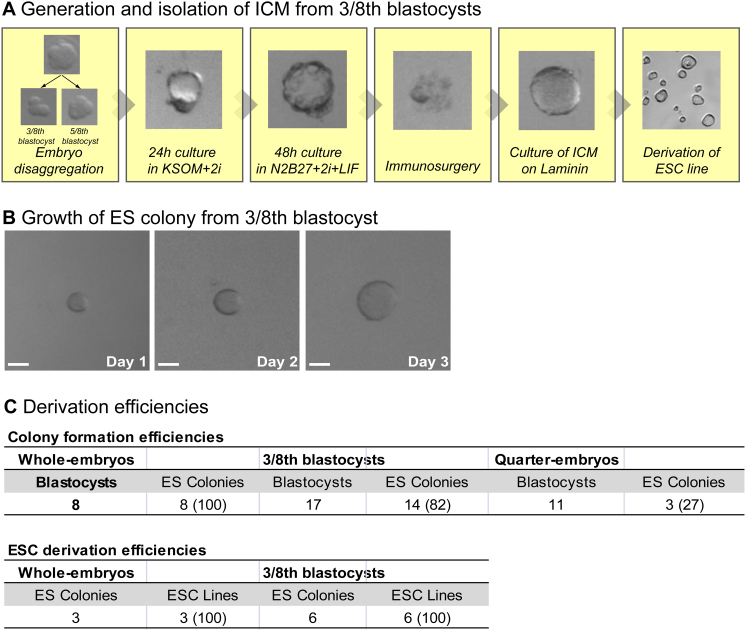
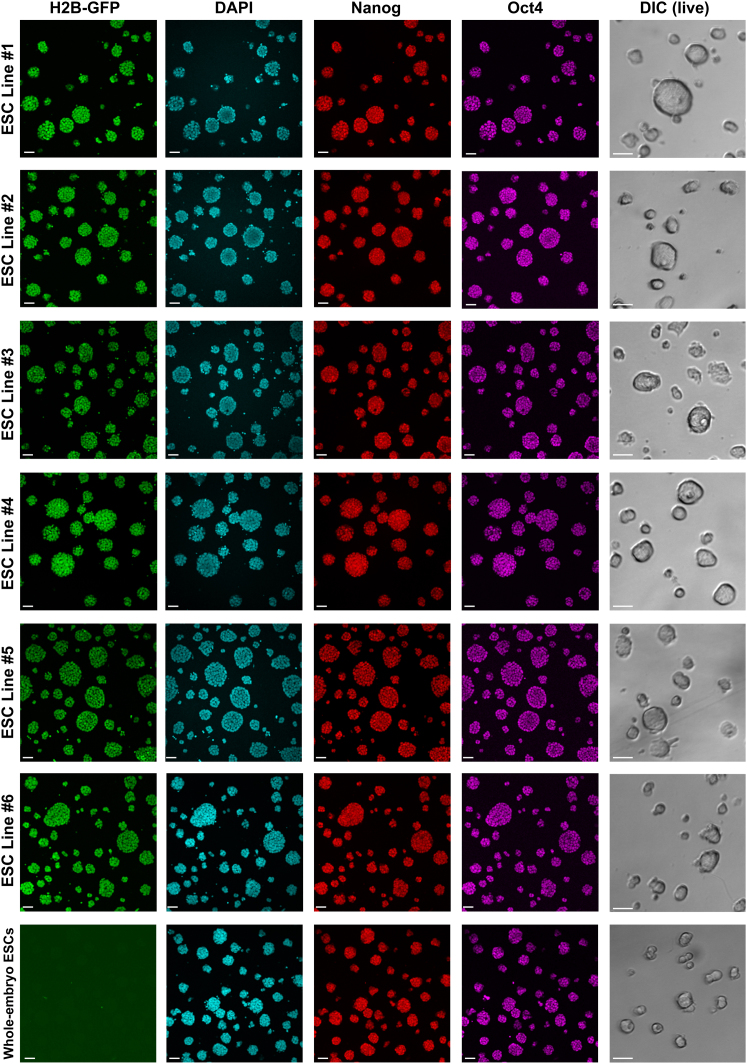
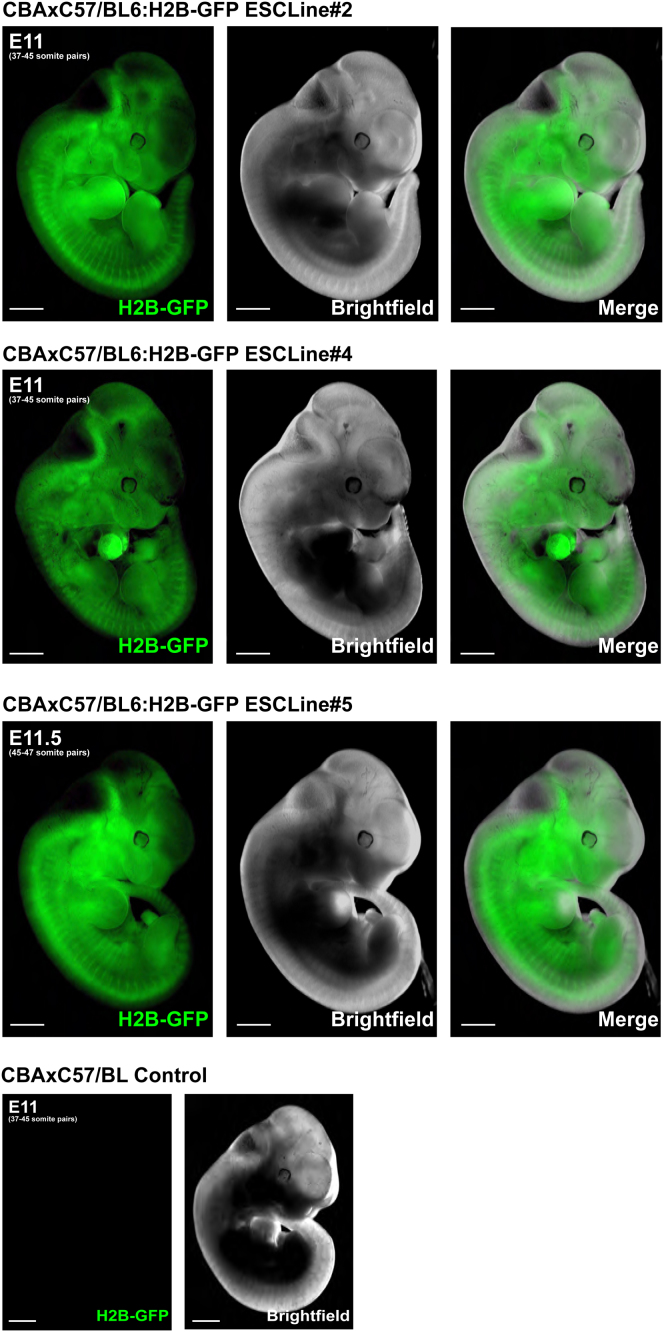
Plasticity is a well-known feature of mammalian development, and yet very little is known about its underlying mechanism. Here, we establish a model system to examine the extent and limitations of developmental plasticity in living mouse embryos. We show that halved embryos follow the same strict clock of developmental transitions as intact embryos, but their potential is not equal. We have determined that unless a minimum of four pluripotent cells is established before implantation, development will arrest. This failure can be rescued by modulating Fgf and Wnt signaling to enhance pluripotent cell number, allowing the generation of monozygotic twins, which is an otherwise rare phenomenon. Knowledge of the minimum pluripotent-cell number required for development to birth, as well as the different potentials of blastomeres, allowed us to establish a protocol for splitting an embryo into one part that develops to adulthood and another that provides embryonic stem cells for that individual.


Figures

None
Graphical abstract
Figure 1
Figure 1
Half-Embryo Development (A) Developmental progression of half embryos (upper row, equivalent stages in parentheses) and whole embryos (lower row). (B) Time-lapse imaging of half-embryo development. Lineage diagram: A, apoptosis; I, inside cell; O, outside cell; 1, wave 1 internalization; 2, wave 2 internalization. (C) Compaction, division, and cavitation occur with the same timing in half and whole embryos imaged side by side (merged differential interference contrast and GFP frames from Movie S1). (D) Proportions of first- and second-wave internalizations in whole embryos (from Morris et al., 2010) and half embryos. (E) Time-lapse imaging of cell internalization by asymmetric division (whole embryo) and engulfment (half embryos). Time: hours:minutes. (F) aPKCζ immunostaining of half and whole embryos in the 4(8)- to 8(16)-cell-stage transition. Scale bars: 50 μM (B) and 25 μM (D and E). (G) Time-lapse imaging of cell internalization by asymmetric division (whole embryo) and engulfment (half embryos) in embryos expressing E-cadherin-GFP. (H) Final fates of cells derived from the first and second waves in half embryos. All error bars indicate standard error. See also Figure S1 and Movies S2, S3, and S4.
Figure 2
Figure 2
ICM Size and Embryo Viability (A) Nanog (EPI), Sox17 (PE), and Cdx2 (TE) immunostaining of whole and half embryos. Bar chart: EPI number frequency in half embryos. (B) EPI number in chimeric half embryos constructed from blastomeres with full developmental potential (AV), reduced potential (A), and restricted potential (V). (C) Development to postimplantation stages (E6.5) of H2B-GFP transgenic half embryos grouped according to EPI number, relative to wild-type whole-embryo carriers. (D) Development to term of H2B-GFP transgenic half embryos with low or high EPI number, relative to wild-type whole-embryo carriers. Scale bars: 50 μM (A), 100 μM (C), and 10 μM (D, inset); 1 cm2 grid (D). All error bars indicate standard error. See also Figure S2.
Figure 3
Figure 3
Rescue of Half-Embryo Development (A) Nanog, Sox17, and Cdx2 immunostaining (projection) of 2i-treated (from four-cell stage to late blastocyst) and untreated half embryos: ICM and TE numbers. (B) Nanog, Sox17, and Cdx2 immunostaining (projection) of transiently 2i-treated and untreated half embryos: EPI and PE numbers. (C) Development to postimplantation stages (E6.5) of 2i-treated and untreated H2B-GFP transgenic half embryos, relative to wild-type whole-embryo carriers. (D) Development to postimplantation stages (E6.5) of 2i-treated and untreated H2B-GFP transgenic twins (p < 0.05, chi-square test). (E) Attempted rescue of quarter-embryo development. Nanog, Sox17, and Cdx2 immunostaining (projection) of 2i-treated and untreated half embryos: EPI and PE numbers. (F) ICM size (Nanog immunostaining, projection) in 2i-treated quarter embryos with known full developmental potential (AV-derived), and restricted potential (A- or V-derived). Scale bars: 50 μM (A), 100 μM (B), and 50 μM (C and D). All error bars indicate standard error.
Figure 4
Figure 4
Generation of ESCs and Mice from Single Embryos (A) Nanog, Sox17, and Cdx2 immunostaining of 5/8th and 3/8th blastocysts. Bar chart: EPI and PE numbers. (B) Nanog and Oct4 immunostaining (single slice) of ES colonies derived from whole embryos and 3/8th blastocysts by immunosurgery, followed by culture in 2i+LIF. Nuclei were counterstained with DAPI. (C) Nanog and Oct4 immunostaining (single slice) of ESC line 4, derived from H2B-GFP transgenic 3/8th embryos. Nuclei were counterstained with DAPI. (D) Fluorescent and bright-field images of a chimera of a wild-type CBAxC57/BL6 embryo and H2B-GFP transgenic ESC line 4. (E) Oct4 immunostaining of genital ridges from the embryo in (D) to visualize primordial germ cells derived from ESCs (white arrows). Nuclei were counterstained with DAPI. (F) Comparison of 2-week-old pups derived from 5/8th H2B-GFP embryos and wild-type whole-embryo littermates. Scale bars: 50 μM (A–C), 1 mm (D), 50 μM (E, left panels), 10 μM (E, right panels), 10 μM (F, inset); 1 cm2 grid (F). All error bars indicate standard error. See also Figures S3, S4, and S5.
Figure S1
Figure S1
Time-Lapse Imaging and Lineage Tracing in Half Embryos, Related to Figure 1 (A) Nanog and Sox17 immunostaining of EPI and PE, respectively, in imaged and cultured embryos shows that imaging conditions do not adversely affect development or ICM cell sorting. (B) Developmental origin, initial ICM position, and final fate of cells tracked in half embryos. Wave-2-derived cells initially are correctly positioned at the ICM surface. Wave-1-derived cells positioned deep are most likely to be eliminated by apoptosis, a mechanism also employed by whole embryos (Morris et al., 2010). (C) Incidence of apoptosis in half embryos. The average is similar to that previously reported for whole embryos (Morris et al., 2010). (D) Multiple z-slices of a GAP43-RFP-expressing half embryo at a single time point. The yellow arrow marks an outside cell in the process of engulfment, maintaining some small amount of outside contact. The red arrow marks a fully engulfed cell in the inside compartment. All error bars indicate standard error.
Figure S2
Figure S2
Half-Embryo Blastocyst Composition, Related to Figure 2 (A) Relationship between PE and EPI numbers in late-blastocyst-stage half embryos as assessed by Sox17 and Nanog immunostaining. EPI number correlates with PE number. (B) Relationship between ICM and TE numbers in late-blastocyst-stage half embryos as assessed by Sox17, Nanog, and Cdx2 immunostaining. There is no significant correlation between ICM and TE numbers. n = 50 half embryos. (C–E) EPI and PE numbers (C), TE number (D), and survival rates (E) of all embryo fragments and whole embryos observed in this study. The PE and TE numbers do not significantly vary between untreated and 2i-rescued half embryos, whereas EPI number significantly increases. Thus, the increased survival rate of 2i-rescued half embryos can be accounted for by the increased EPI population. All error bars indicate standard error.
Figure S3
Figure S3
Derivation of ESCs, Related to Figure 4 (A) Generation and isolation of ICM from embryo fragments. Eight-cell-stage embryos are split into five blastomere and three blastomere portions. The 3/8th fragment is cultured in 2i for 24 h to the early blastocyst stage, followed by a further 48 h culture in N2B27+2i+LIF. Extraembryonic tissue is removed from the 3/8th blastocyst by immunosurgery, whereupon the ICM consisting only of EPI cells is cultured on laminin in N2B27+2i+LIF for 3–5 days to form an ES colony. After sufficient growth, the colony is disaggregated with trypsin and plated on laminin to establish an ESC line. The remaining 5/8th embryo fragment is transferred to a surrogate female at the early blastocyst stage. (B) Growth of ES colony derived from a 3/8th blastocyst over 3 days. Scale bars: 50 μM. (C) Efficiencies of ES colony formation and ESC derivation from whole embryos, 3/8th blastocysts, and quarter embryos. Fourteen ES colonies were derived from 17 3/8th blastocysts, corresponding to 82% efficiency. Six ESC lines were established from six of these colonies, and the remaining colonies were analyzed for Nanog and Oct4 expression. All error bars indicate standard error.
Figure S4
Figure S4
ESC Lines Derived from 3/8th Embryos, Related to Figure 4 All six ESC lines derived from H2B-GFP transgenic 3/8th embryos were imaged in culture (differential interference contrast) and following fixation were immunostained for Nanog and Oct4. Nuclei were counterstained with DAPI. ESCs derived from wild-type whole embryos were derived and immunostained for comparison. Scale bars: 50 μM. All error bars indicate standard error.
Figure S5
Figure S5
ESC Contribution to Chimeras, Related to Figure 4 Three of the six ESC lines derived from 3/8th embryos were aggregated with wild-type embryos at the eight-cell stage and transferred to surrogate females at the early blastocyst stage. Embryos recovered at E11.5 were imaged under fluorescence and bright field to visualize tissues derived from H2B-GFP ESC cells. Tissues from all three germ layers were extensively contributed by all three ESC lines tested. Incidence of chimerism: ESC line 2: four of four embryos chimeric; ESC line 4: four of four embryos chimeric; ESC line 5: two of three embryos chimeric. A wild-type embryo is included for comparison. Scale bars: 1 mm. All error bars indicate standard error.

References

    1. Bischoff M., Parfitt D.E., Zernicka-Goetz M. Formation of the embryonic-abembryonic axis of the mouse blastocyst: relationships between orientation of early cleavage divisions and pattern of symmetric/asymmetric divisions. Development. 2008;135:953–962. - PMC - PubMed
    1. Chazaud C., Yamanaka Y., Pawson T., Rossant J. Early lineage segregation between epiblast and primitive endoderm in mouse blastocysts through the Grb2-MAPK pathway. Dev. Cell. 2006;10:615–624. - PubMed
    1. Eakin G.S., Hadjantonakis A.K. Production of chimeras by aggregation of embryonic stem cells with diploid or tetraploid mouse embryos. Nat. Protoc. 2006;1:1145–1153. - PMC - PubMed
    1. Hadjantonakis A.K., Papaioannou V.E. Dynamic in vivo imaging and cell tracking using a histone fluorescent protein fusion in mice. BMC Biotechnol. 2004;4:33. - PMC - PubMed
    1. Jedrusik A., Parfitt D.E., Guo G., Skamagki M., Grabarek J.B., Johnson M.H., Robson P., Zernicka-Goetz M. Role of Cdx2 and cell polarity in cell allocation and specification of trophectoderm and inner cell mass in the mouse embryo. Genes Dev. 2008;22:2692–2706. - PMC - PubMed

Supplemental References

    1. Eakin, G.S., and Hadjantonakis, A.K. (2006). Production of chimeras by aggregation of embryonic stem cells with diploid or tetraploid mouse embryos. Nat. Protoc. 1, 1145–1153. - PMC - PubMed
    1. Nichols, J., Silva, J., Roode, M., and Smith, A. (2009). Suppression of Erk signaling promotes ground state pluripotency in the mouse embryo. Development 136, 3215–3222. - PMC - PubMed
    1. Solter, D., and Knowles, B.B. (1975). Immunosurgery of mouse blastocyst. Proc. Natl. Acad. Sci. USA 72, 5099–5102. - PMC - PubMed

Publication types

LinkOut - more resources