. 2012 Dec;181(6):1903-10.
doi: 10.1016/j.ajpath.2012.08.024. Epub 2012 Oct 4.

The onco-embryonic antigen ROR1 is expressed by a variety of human cancers

Affiliations

The onco-embryonic antigen ROR1 is expressed by a variety of human cancers

Suping Zhang et al. Am J Pathol. 2012 Dec.

Abstract

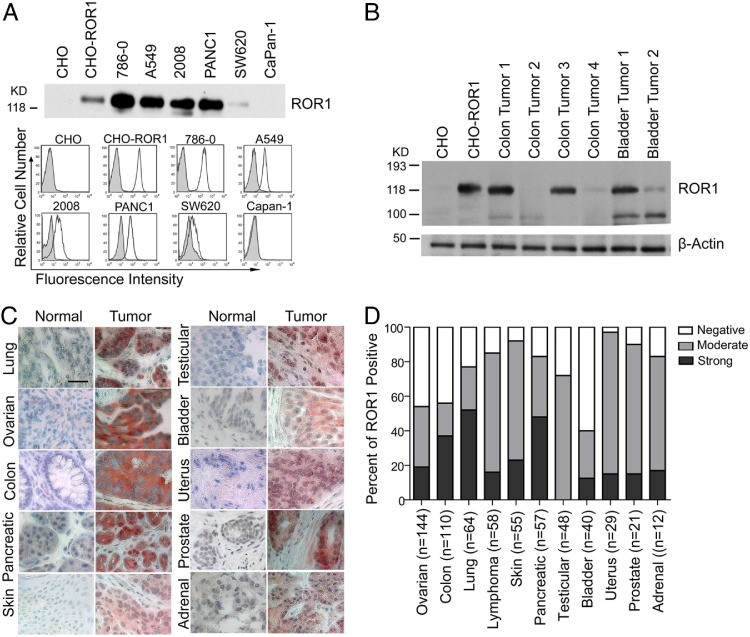
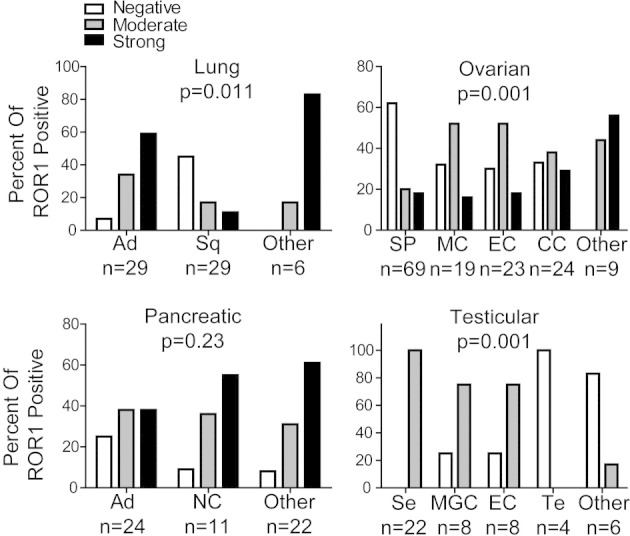
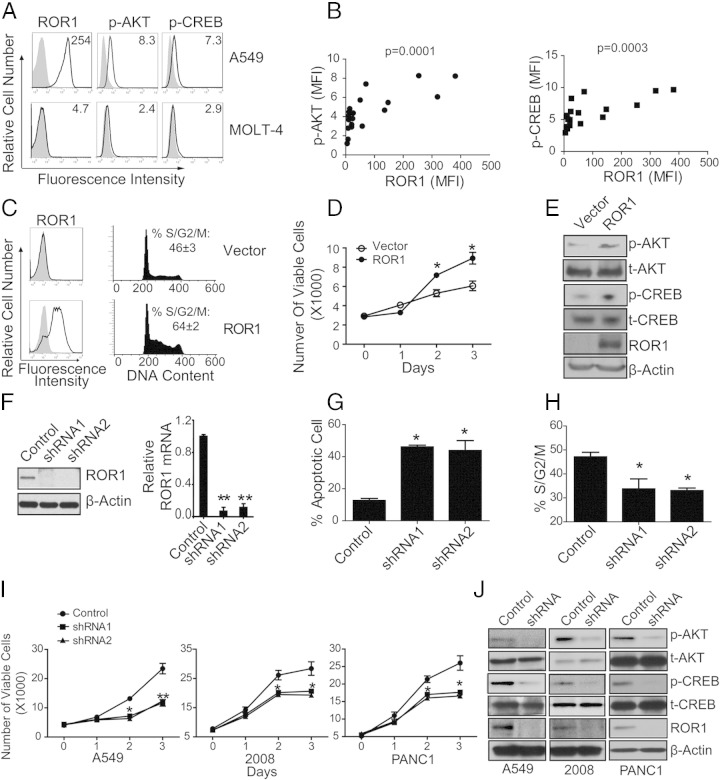
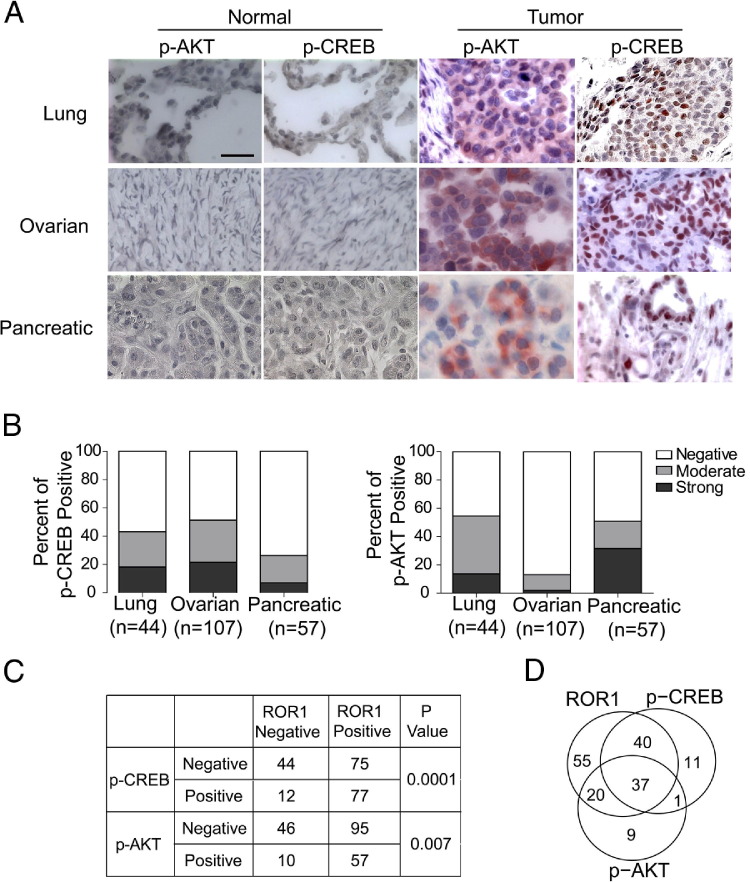
ROR1 is an orphan-receptor tyrosine-kinase-like surface antigen that is expressed by many tissues during embryogenesis, some B-cell malignancies, and various cancer cell lines but not by virtually all normal adult tissues. Here, we report that large proportions of many different human cancers also express ROR1, particularly those cancers that have high-grade histology. Primary cancers that expressed ROR1 more commonly expressed high levels of phosphorylated AKT (p-AKT) and phosphorylated cAMP response element binding-factor (p-CREB) than similar cancers that lacked expression of ROR1. Induced expression of ROR1 could enhance basal p-AKT and p-CREB levels and could promote the growth of a cancer cell line, MEC1. Conversely, silencing ROR1 resulted in lower levels of p-AKT and p-CREB, which was associated with impaired tumor cell growth. In summary, this study found that many different human cancers express ROR1 and that ROR1 may play a functional role in promoting tumor cell growth, suggesting that this orphan-receptor tyrosine-kinase-like protein may be a potential target for therapy directed against a variety of human cancers.


Figures

Figure 1
Figure 1
ROR1 is expressed by a variety of different human cancer cells. A: Immunoblots of immune precipitates with 4A5, using lysates of various cell lines (as indicated at the top of each lane) were probed with rabbit anti-ROR1-peptide antibody (top panel). Chinese hamster ovary (CHO) cells made to express ROR1 (CHO-ROR1) were loaded as a positive control. Protein sizes are indicated on the left. Histograms in the bottom panel depict fluorescence of CHO, CHO-ROR1, or human cancer cell lines (786-0, A549, 2008, PANC1, SW620, or Capan-1; as indicated on the top of each panel) when stained with flurochrome-conjugated 4A5 (open histograms) or IgG2b isotope control monoclonal antibody (mAb; shaded histograms). B: Protein lysates from CHO cells, CHO cells made to express ROR1, or adenocarcinomas of the colon or bladder of different patients were probed with anti-ROR1 antibodies (top row) or β-actin (bottom row), which served to control for the amounts of protein in each lysate. Protein sizes are indicated on the left. C: Formalin-fixed, paraffin-embedded tissue microarray sections of normal or neoplastic tissues were stained with 4A5 or control IgG2b. Tissue-bound 4A5 is shown in red, and the nuclear staining with hematoxylin is in blue. Scale bar = 35 μm (top left). D: The proportion of each tumor type found negative (negative 4A5 staining on all tumor cells), weak to moderate (low-level binding of the mAb to the tumor cells or low-to-moderate-level binding of the mAb on ≤50% of tumor cells), or strong (moderate-level staining on >50% of tumor cells or high-level staining of the tumor cells) staining for ROR1 are indicated by the shading in each bar. The black shading represents the proportion of cases that have strong staining, the gray shading depicts the proportion of cases that have moderate staining, and the nonshaded open area indicates the proportion cases that lack staining for ROR1 of each of the various human cancers examined, as indicated at the bottom of each bar. The number of different cases examined for each tumor type is indicated in the parentheses.
Figure 2
Figure 2
The distribution of ROR1 in different histologic subtypes of various cancers. The proportion of tumor cells found to have negative, moderate, or strong staining for ROR1 are indicated in each of the various histologic subtypes of various cancers examined as indicated at the bottom of each bar. The number of different cases examined for each tumor type is indicated at the bottom. Statistical significance of the differences was analyzed with the Kruskal–Wallis test. Lung cancer tissues: Ad, adenocarcinoma; Sq, squamous cell carcinoma. Ovarian cancer tissues: SP, serous papillary carcinoma; MC, mucinous adenocarcinoma; EC, endometrioid adenocarcinoma; CC, clear cell carcinoma. Pancreatic cancer tissues: Ad, adenocarcinoma; NC, neuroendocrine cancer. Testicular cancer tissues: Se, seminoma; MGC, mixed germ cell; EC, embryonal carcinoma; Te, teratoma.
Figure 3
Figure 3
Expression of ROR1 in cancer cell lines was associated with activation of AKT/CREB and silencing ROR1 expression impaired cell growth. A: Representative fluorescence histograms of cancer cell lines (A549 and MOLT-4) stained with 4A5, p-AKT, or p-CREB (open histograms) or isotype-control mAb (shaded histograms), respectively. Mean fluorescence intensity (MFI) was indicated on the top of each figure. B: Correlation of ROR1 expression level with either p-AKT or p-CREB in various cancer cell lines. ROR1 versus p-AKT: Pearson r = 0.7459, P = 0.0001; ROR1 versus p-CREB: Pearson r = 0.7106, P = 0.0003. C: MEC1 cells stably transfected with either empty vector (Vector) or vector encoding ROR1 (ROR1) were cultured in serum-free medium for 24 hours and then in full medium for 16 hours. Cell-cycle distributions were determined by staining with propidium iodide (PI). Fluorescence histograms depicts cells stained with either 4A5 (open histograms) or isotype-control mAb (shaded histograms), respectively. Representative histograms show DNA content in these cell lines. Live cells were gated with the forward and side scatter parameters, FL2W and FL2A parameters were used to gate on single cells and to exclude doublets, and the FL2A channel was used to measure DNA content. The fraction of cells in each phase of the cell cycle was determined according to the Watson model, using the Cell-cycle analysis tool of the FlowJo software. The mean percentage of cells in S/G2/M ± SEM (n = 3 experiments) is indicated on the top of each figure. D: Control MEC1 cells or MEC1 expressing ROR1 were cultured in serum-free medium overnight. Equal numbers of these cells were then seeded into separate, triplicate wells for culture in complete growth medium. The numbers of viable cells per well were assessed over time with the use of the WST-8 assay. The y axis indicates the average number of viable cells per well on day 0, 1, 2, or 3 after initiation of culture in complete growth medium. The error bars indicate the SEM for triplicate cultures. *P < 0.05. E: Protein lysates from control MEC1 cells or MEC1 cells made to express ROR1 were probed with the antibodies as indicated. F: A549 tumor cells were transduced with vectors encoding control short hairpin RNA (Ct-shRNA) or ROR1 shRNA and then selected for stable expression of the shRNA. Lysates of cells selected for stable expression of Ct-shRNA or ROR1 shRNA were examined for ROR1 or β-actin via immunoblot analyses. Relative expression of ROR1 mRNA quantitated by RT-PCR as indicated. The numbers on the y axis represent fold difference in ROR1 expression relative to GAPDH. Error bars indicate SEM (n = 3 experiments). G: The mean proportion of apoptotic sub-G1 population in A549 cells transiently transfected with control shRNA (control) or ROR1 shRNAs (shRNA). The error bars indicate the SE of triplicate samples. *P < 0.05 multiple comparison test. H: The percentage of cells in S/G2/M of A549 cells expressing control shRNA or ROR1 shRNA are indicated. The error bars indicate the SE of triplicate samples. *P < 0.05, multiple comparison test. I: Equal numbers of A549, 2008, or PANC1 cancer cells made to express control shRNA or ROR1 shRNA, as indicated in the legend, were cultured and monitored for growth over time. Data represent average number of viable cells assessed at times 0, 1, 2, or 3 days, using the WST-8 assay. The error bars indicate the SE of the mean for triplicate samples. *P < 0.05, **P < 0.01. J: Immunoblot analysis of CREB phosphorylation at ser-133 (p-CREB), total CREB (t-CREB), AKT phosphorylation at ser-473 (p-AKT), total AKT (t-AKT), ROR1, or β-actin for A549, 2008, or PANC1 tumor cells that had or had not been silenced for ROR1, as indicated on the top of each panel.
Figure 4
Figure 4
Activation of AKT and CREB in lung, ovarian, and pancreatic tumor tissues is associated with ROR1 expression. A: Representative immunohistochemistry staining for p-AKT and p-CREB in different normal or cancer tissue specimens. Tissue-bound p-AKT or p-CREB is shown in red, and the nuclear staining with hematoxylin is in blue. Scale bar = 35 μm (top left). B: The proportion of tumor cells found to have negative, weak-to-moderate, or strong staining for p-AKT or p-CREB are indicated for each tumor type. The number of different cases examined for each tumor type is indicated in parentheses. Negative indicates that there was no detectable monoclonal antibody (mAb) staining for all tumor cells; moderate indicates that there was low-level binding of the mAb to all tumor cells or low-to-moderate-level binding of the mAb on ≤50% of tumor cells; strong indicates that there was moderate-level staining on >50% of tumor cells or high-level staining on tumor cells. C: Significant association of ROR1 expression with p-CREB and/or p-AKT in various human cancers (eg, lung, ovarian, or pancreatic neoplasms), as assessed with Fisher's exact test. D: The Venn diagram shows the distribution and number of cases that express ROR (top left), p-AKT (bottom), and/or p-CREB (top right) in various human cancers (ie, lung, ovarian, and pancreatic neoplasms). The numbers indicate the numbers of cases that express ROR1, p-CREB, p-AKT, or a combination.

References

    1. Barna G., Mihalik R., Timar B., Tombol J., Csende Z., Sebestyen A., Bodor C., Csernus B., Reiniger L., Petak I., Matolcsy A. ROR1 expression is not a unique marker of CLL. Hematol Oncol. 2011;29:17–21. - PubMed
    1. Baskar S., Kwong K.Y., Hofer T., Levy J.M., Kennedy M.G., Lee E., Staudt L.M., Wilson W.H., Wiestner A., Rader C. Unique cell surface expression of receptor tyrosine kinase ROR1 in human B-cell chronic lymphocytic leukemia. Clin Cancer Res. 2008;14:396–404. - PubMed
    1. Daneshmanesh A.H., Mikaelsson E., Jeddi-Tehrani M., Bayat A.A., Ghods R., Ostadkarampour M., Akhondi M., Lagercrantz S., Larsson C., Osterborg A., Shokri F., Mellstedt H., Rabbani H. Ror1, a cell surface receptor tyrosine kinase is expressed in chronic lymphocytic leukemia and may serve as a putative target for therapy. Int J Cancer. 2008;123:1190–1195. - PubMed
    1. Fukuda T., Chen L., Endo T., Tang L., Lu D., Castro J.E., Widhopf G.F., II, Rassenti L.Z., Cantwell M.J., Prussak C.E., Carson D.A., Kipps T.J. Antisera induced by infusions of autologous Ad-CD154-leukemia B cells identify ROR1 as an oncofetal antigen and receptor for Wnt5a. Proc Natl Acad Sci U S A. 2008;105:3047–3052. - PMC - PubMed
    1. Rabbani H., Ostadkarampour M., Danesh Manesh A.H., Basiri A., Jeddi-Tehrani M., Forouzesh F. Expression of ROR1 in patients with renal cancer–a potential diagnostic marker. Iran Biomed J. 2010;14:77–82. - PMC - PubMed

Publication types

MeSH terms

Substances