. 2012 Nov;122(11):4037-47.
doi: 10.1172/JCI60659. Epub 2012 Oct 8.

Cross-presenting CD103+ dendritic cells are protected from influenza virus infection

Affiliations

Cross-presenting CD103+ dendritic cells are protected from influenza virus infection

Julie Helft et al. J Clin Invest. 2012 Nov.

Abstract

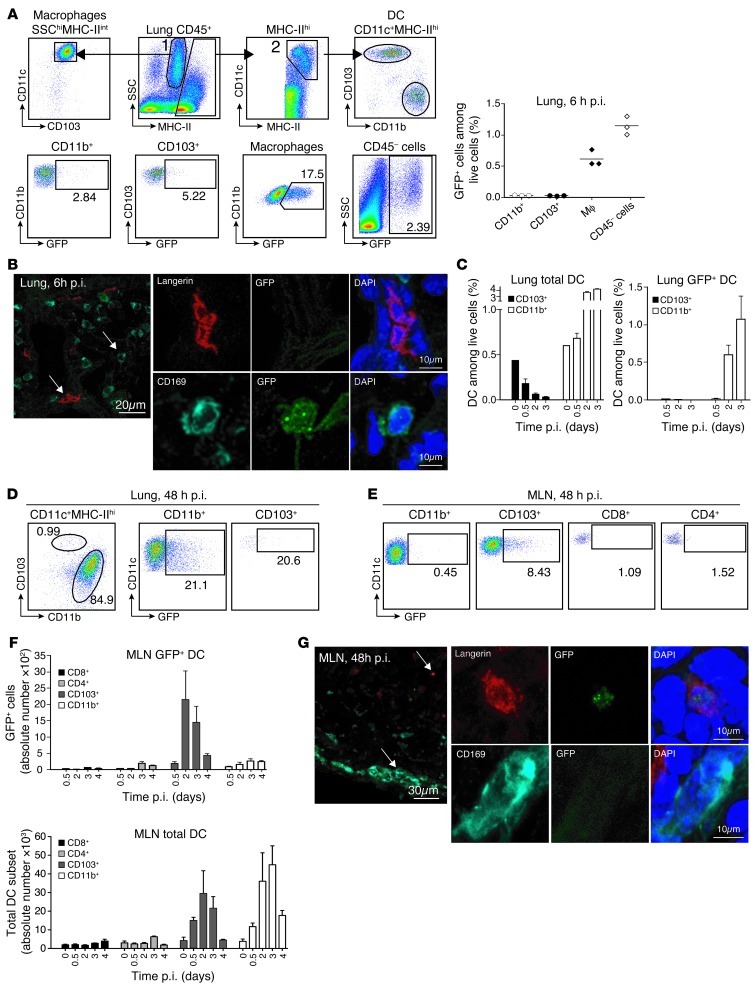
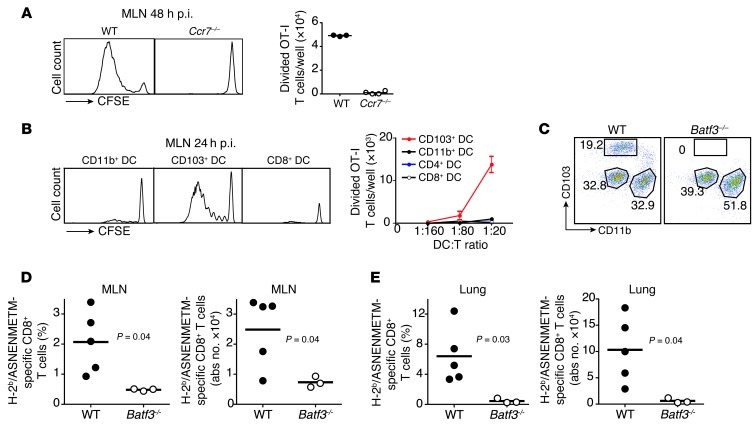
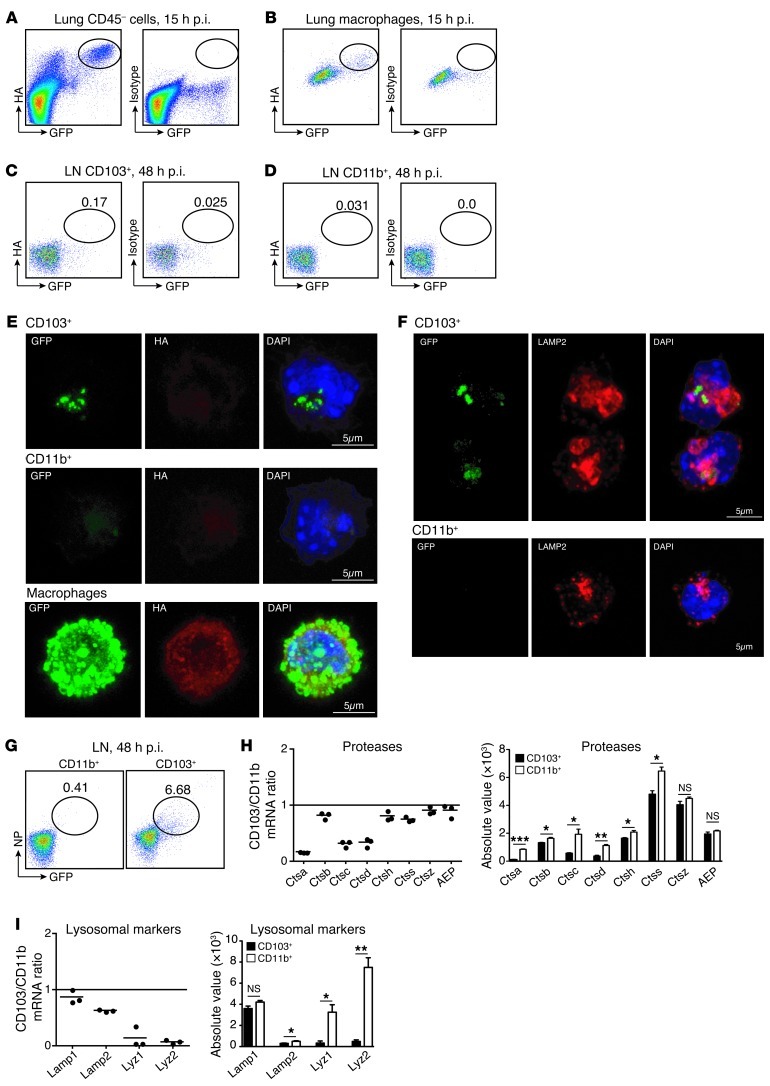
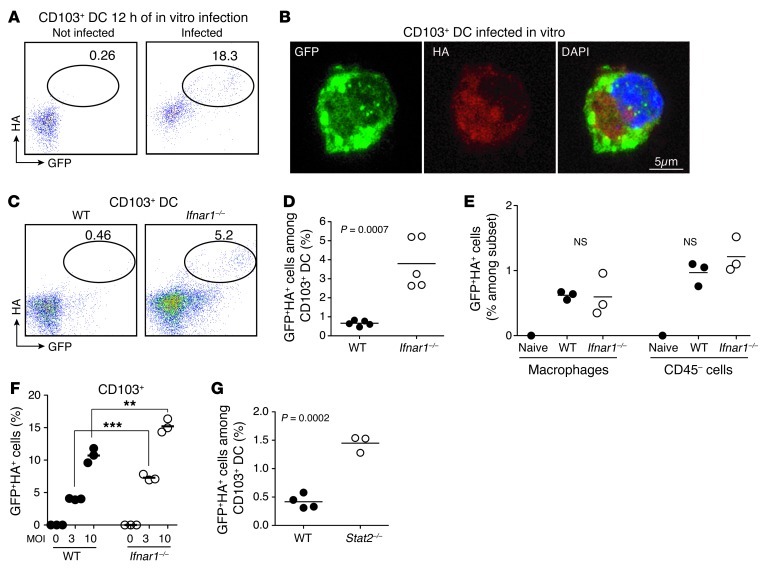
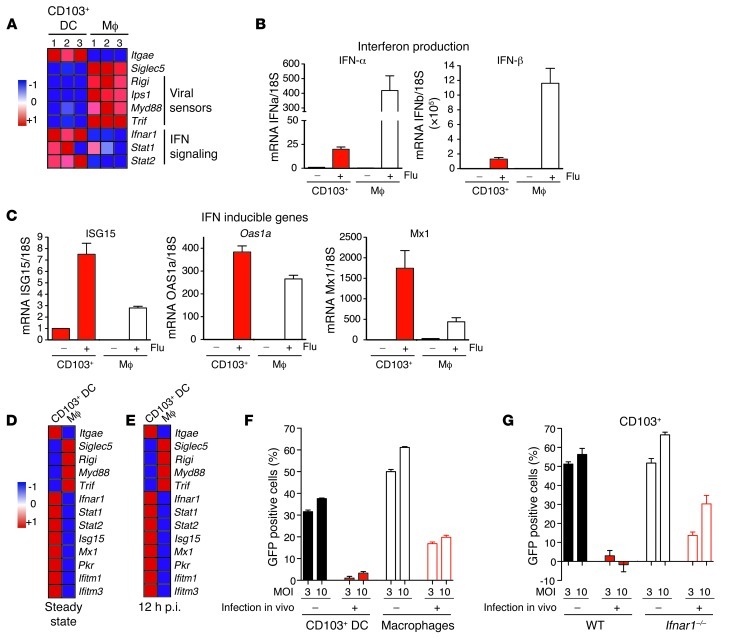
CD8+ cytotoxic T cells are critical for viral clearance from the lungs upon influenza virus infection. The contribution of antigen cross-presentation by DCs to the induction of anti-viral cytotoxic T cells remains controversial. Here, we used a recombinant influenza virus expressing a nonstructural 1-GFP (NS1-GFP) reporter gene to visualize the route of antigen presentation by lung DCs upon viral infection in mice. We found that lung CD103+ DCs were the only subset of cells that carried intact GFP protein to the draining LNs. Strikingly, lung migratory CD103+ DCs were not productively infected by influenza virus and thus were able to induce virus-specific CD8+ T cells through the cross-presentation of antigens from virally infected cells. We also observed that CD103+ DC resistance to infection correlates with an increased anti-viral state in these cells that is dependent on the expression of type I IFN receptor. These results show that efficient cross-priming by migratory lung DCs is coupled to the acquisition of an anti-viral status, which is dependent on the type I IFN signaling pathway.


Figures

Figure 1
Figure 1. Tracking viral antigens during influenza infection in vivo.
C57BL/6 mice were infected intranasally with 106 PFUs of NS1-GFP virus. (A) Six hours post infection (p.i.), GFP levels were assessed by flow cytometry in CD45+ lung cells: MHCIIhiCD11c+CD103+ DC (gate 2), MHCIIhiCD11c+CD11b+ DC (gate 2), SSChiMHCIIloCD11c+CD103macrophages (gate 1), and epithelial CD45 cells. Lower panels show a representative percentage of GFP+ cells gated among each lung population. Graph represents the percentage of GFP+ cells among live lung cells. (B) Images show GFP expression in lung sections 6 hours after infection stained with anti-langerin and anti-CD169 Abs and analyzed by confocal microscopy. White arrows show CD169+ macrophage and langerin+ DCs. Original magnification, ×40, zoom 6. (C) Percentage of total DCs (left panel) or GFP+ DCs (right panel) among live lung cells at the indicated time points after infection (n = 3). (D) Representative dot plots showing the percentage of each DC population in the lung 48 hours after infection (left panel) and the percentage of GFP+ cells in each lung DC subset (middle and right panels). (E) Dot plots show the percentage of GFP expression in each MLN DC subset 48 hours after infection. Gating strategy is described in Supplemental Figure 1F. (F) Absolute numbers of total DC subsets (lower panel) or GFP+ DC subsets (upper panel) in the MLNs at the indicated time points after NS1-GFP infection. (G) Images show GFP expression in MLN sections isolated 48 hours after infection, stained with anti-langerin and anti-CD169 mAbs, and analyzed by confocal microscopy. White arrows show CD169+ subcapsular macrophage and langerin+ DCs. Original magnification ×40, zoom 6.
Figure 2
Figure 2. Lung tissue migratory CD103+ DCs control anti-viral CD8+ T cell immunity.
(A) WT and Ccr7–/– mice were infected with 107 PFUs of PR8-OTI virus. Forty-eight hours later, MLN cells were cocultured with CFSE-labeled CD8+ OT-I T cells for 3 days. Proliferation was measured by flow cytometry assessment of CFSE dilution (representative histograms). Graph represents the number of divided T cells per well. Each dot represents 1 mouse. (B) WT mice were infected with 107 PFUs of PR8-OTI virus. Lung migratory CD103+ DCs and CD11b+ DCs and LN-resident CD8+ and CD4+ DCs purified from the MLN 24 hours after infection were cocultured with CFSE-labeled CD8+ OT-I T cells for 3 days. Proliferation was measured by flow cytometry assessment of CFSE dilution (representative histograms). Graph represents the number of divided T cells per well after coculture with different numbers of DCs per well (DC:T ratio). Data are representative of 3 separate experiments. (C) CD45+CD11c+MHCII+ lung phagocyte populations (CD103+ DCs, CD11b+ DCs, and CD103CD11b alveolar macrophages) were analyzed by flow cytometry in naive WT and Batf3–/– mice. Representative percentages of each population in the CD45+CD11c+MHCII+ gate are noted. (D and E) WT and Batf3–/– mice were infected with 3 × 10³ PFUs of NS1-GFP virus. Seven days later, the percentages and absolute numbers of NP-specific endogenous CD8+ T cells in the MLNs (D) and the lungs (E) were measured by flow cytometry using H2Db/ASNENMETM-specific dextramer staining. Graphs represent the percentage (%) and the absolute numbers (abs no.) of dextramer-positive CD8+ T cells among total CD3+CD8+B220 T cells. Data are representative of 3 separate experiments.
Figure 3
Figure 3. CD103+ migratory DCs are not infected by influenza virus and uniquely preserve viral proteins in endosomal compartments.
(AI) Mice were infected with 106 PFUs of NS1-GFP virus. HA expression was measured by flow cytometry in CD45 lung cells (A) and alveolar macrophages (B) 15 hours after infection or in MLN CD103+ (C) and CD11b+ DCs (D) 48 hours after infection. Percentage of GFP+ cells in each population is noted in C and D. (E) Cell-surface HA expression was measured by confocal microscopy in MLN CD103+GFP+ DCs and CD11b+ DCs purified 48 hours after infection and lung alveolar macrophages purified 15 hours after infection. Original magnification, ×63, zoom 3. (F) Intracellular LAMP2 expression was analyzed by confocal microscopy in migratory CD103+GFP+ or CD11b+ DCs, isolated from the MLNs 48 hours after infection. Original magnification, ×63, zoom 3. (G) Intracellular NP expression was measured by flow cytometry in MLN cells isolated 48 hours after infection. Dot plots show percentage of intracellular NP expression among migratory CD103+ and CD11b+ DCs. (H and I) Affymetrix gene chip arrays of CD11b+ and CD103+ migratory DCs sorted from the MLNs of naive mice. Graphs represent mRNA transcript ratio between CD103+ DCs and CD11b+ DCs. Each dot represents 1 experiment. Bars represent the mRNA transcript absolute values for each gene. Data are representative of 3 separate experiments. *P ≤ 0.05, **P ≤ 0.01, ***P ≤ 0.001.
Figure 4
Figure 4. Type I IFNs protect migratory DCs from influenza virus infection in vivo.
(A and B) Lung CD103+ DCs were purified from naive mice and infected in vitro with NS1-GFP virus (10 MOI). Twelve hours after infection, cell-surface expression of HA was measured in CD103+ DCs by flow cytometry (A) and confocal microscopy analysis (B). Original magnification, ×63, zoom 3. A representative percentage of GFP+ cells among CD103+ DCs is shown in A. (CE) WT and Ifnar1–/– mice were infected with 106 PFUs of NS1-GFP virus. Dot plots and graph show the percentages of GFP+HA+ cells among CD103+ (C) and CD11b+ (D) DCs isolated from MLNs 48 hours after infection. In the graph, each dot represents 1 mouse. Data are representative of 3 separate experiments (n = 3). (E) Percentages of GFP+HA+ cells among alveolar macrophages and CD45 epithelial cells isolated from the lungs 12 hours after infection. Each dot represents 1 mouse. (F) Lung CD103+ DCs isolated from WT CD45.1+C57BL/6 or Ifnar1–/– CD45.2+C57BL/6 mice were mixed at 1:1 ratio, plated in vitro, and infected with the indicated NS1-GFP virus MOI. Plots represent the percentages of GFP+HA+ cells among WT or Ifnar1–/– DCs 12 hours after infection. Each dot represents 1 well. Data are representative of 2 separate experiments. **P ≤ 0.01, ***P ≤ 0.001. (G) WT and Stat2–/– mice were infected with 106 PFUs of NS1-GFP virus. Graph shows the percentages of GFP+HA+ cells among CD103+ DCs isolated from MLNs 48 hours after infection (n = 3 to 4). Each dot represents 1 mouse.
Figure 5
Figure 5. CD103+ DCs present an anti-viral state that protects them from viral infection.
(A) Heat map of mRNA transcript relative value comparing the microarray analysis of CD103+ DCs and alveolar macrophages (Mϕ) purified from the lung naive mice (n = 3). Red represents high relative expression, while blue represents low relative expression. (B and C) Quantitative PCR (qPCR) analysis of lung alveolar macrophages and CD103+ DCs purified from WT mice 12 hours after infection with 106 PFUs of NS1-GFP virus. mRNA levels are normalized for each population to the level of housekeeping gene 18S (n = 3). (D and E) Deep sequencing mRNA analysis of lung alveolar macrophages and CD103+ DCs purified from lungs of naive WT mice (steady state) (D) or mice infected 12 hours earlier with 106 PFUs of NS1-GFP virus. (E). Heat maps present the relative mRNA expression levels between CD103+ DCs and alveolar macrophages in the indicated mice. Red represents high relative expression, while blue represents low relative expression. (F and G) WT mice (F) and Ifnar1–/– mice (G) were injected intranasally with 106 PFUs of NS1-GFP or PBS. Twelve hours later, alveolar macrophages (F) and CD103+ DCs (F and G) were purified from the lungs of naive or infected mice and cultured in 96-well plates for 12 hours with 3 or 10 MOI of NS1-GFP virus in vitro. Graphs represent the percentage of GFP-positive cells measured by flow cytometry 12 hours after in vitro infection. The baseline GFP expression level is subtracted from the GFP expression after in vitro infection. Data are representative of 3 separate experiments.

References

    1. Sigal LJ, Crotty S, Andino R, Rock KL. Cytotoxic T-cell immunity to virus-infected non-haematopoietic cells requires presentation of exogenous antigen. Nature. 1999;398(6722):77–80. doi: 10.1038/18038. - DOI - PubMed
    1. Yewdell JW. Designing CD8+ T cell vaccines: it’s not rocket science (yet). Curr Opin Immunol. 2010;22(3):402–410. doi: 10.1016/j.coi.2010.04.002. - DOI - PMC - PubMed
    1. Heath WR, Carbone FR. Dendritic cell subsets in primary and secondary T cell responses at body surfaces. Nat Immunol. 2009;10(12):1237–1244. doi: 10.1038/ni.1822. - DOI - PubMed
    1. GeurtsvanKessel CH, et al. Clearance of influenza virus from the lung depends on migratory langerin+CD11b- but not plasmacytoid dendritic cells. J Exp Med. 2008;205(7):1621–1634. doi: 10.1084/jem.20071365. - DOI - PMC - PubMed
    1. Edelson BT, et al. Peripheral CD103+ dendritic cells form a unified subset developmentally related to CD8alpha+ conventional dendritic cells. J Exp Med. 2010;207(4):823–836. doi: 10.1084/jem.20091627. - DOI - PMC - PubMed

Publication types

MeSH terms