. 2013 Jan-Feb;13(1-2):21-9.
doi: 10.1016/j.gep.2012.09.001. Epub 2012 Oct 4.

Immunohistochemical analysis of sphingosine phosphate lyase expression during murine development

Affiliations

Immunohistochemical analysis of sphingosine phosphate lyase expression during murine development

Susan Newbigging et al. Gene Expr Patterns. 2013 Jan-Feb.

Abstract

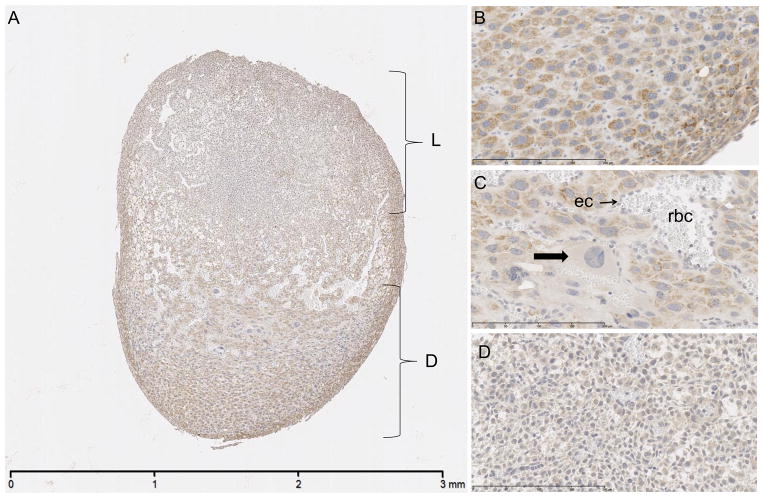
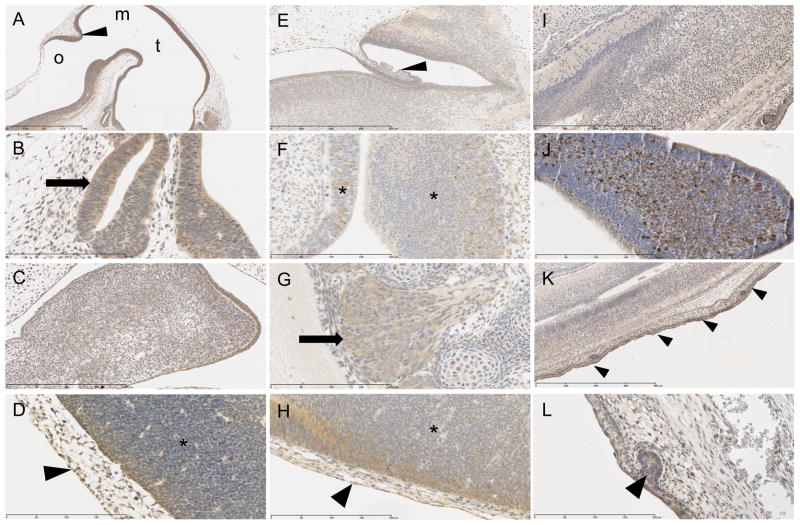
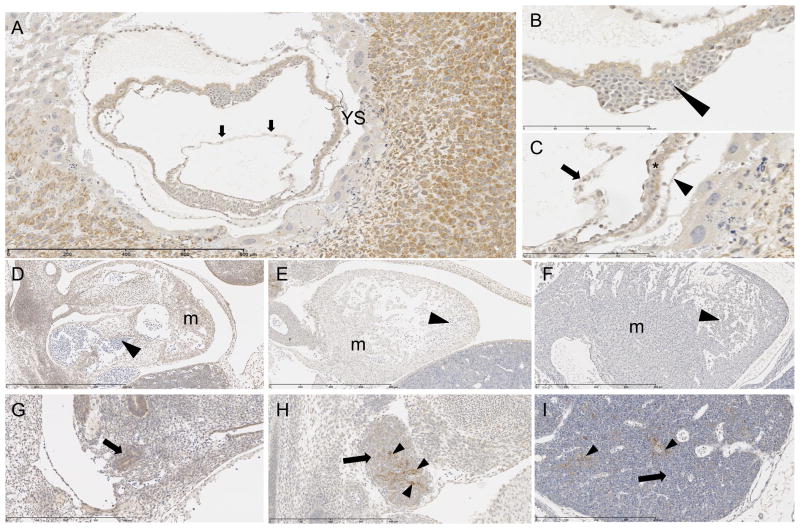
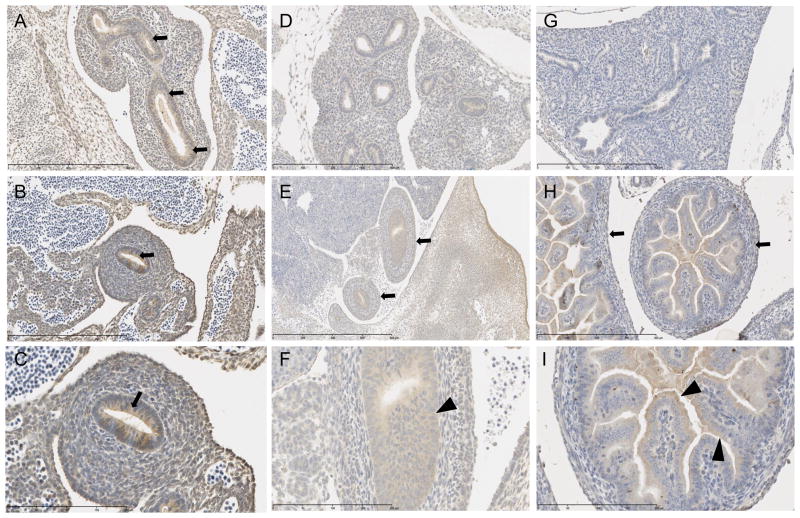
Sphingosine-1-phosphate lyase (SPL) catalyzes the degradation of sphingosine-1-phosphate (S1P), a bioactive lipid that controls cell proliferation, migration and survival. Mice lacking SPL expression exhibit developmental abnormalities, runting and death during the perinatal period, suggesting that SPL plays a role in mammalian development and adaptation to extrauterine life. We investigated the pattern of SPL expression in the mouse embryo and placenta from day 8 to day 18. Our findings reveal that SPL is expressed in the developing brain and neural tube, Rathke's pouch, first brachial arch, third brachial arch, optic stalk, midgut loops, and lung buds. Diffuse signal was high at E12, whereas a recognizable adult SPL pattern was evident by E15 and more intensely at E18, with strong expression in skin, nasal epithelium, intestinal epithelium, cartilage, thymus and pituitary gland. These findings suggest SPL may be involved in development of the mammalian central nervous system (CNS), anterior pituitary, trigeminal nerve, palate and facial bones, thymus and other organs. Our findings are consistent with the SPL expression pattern of the adult mouse and with congenital abnormalities observed in SPL mutant mice.


Figures

Fig 1
Fig 1
Sagittal embryo sections. Immunostained for SPL protein, counterstained with hematoxylin. A. Wild type E12 embryo with ubiquitous moderate to strong staining throughout all organ systems. Scale bar 6mm. B. Wild type E15 embryo revealed mild to moderate ubiquitous staining throughout all organs. Scale bar 8 mm. C. Wild type E18 with a range of moderate to strong, more organ specific immunopositivity. Scale bar 10 mm. D. SPL knockout E12 embryo negative control. Scale bar 5 mm E. SPL knockout E15 embryo negative control. Scale bar 5 mm. h – heart, in – intestine, lat – lateral ventricle, lv – liver, m- mesencephalon, nt – neural tube, o – fourth ventricle, oe – olfactory epithelium, sc – spinal cord, t- telencephalon.
Fig 2
Fig 2
E8 placenta. Immunostained for SPL protein, counterstained with hematoxylin. A. Decidua (D) with moderate to strong cytoplasmic signal and weaker signal in labyrinth (L). Scale bar 3 mm. B. Decidual cells with minimal to mild cytoplasmic signal. Scale bar 200 um. C. Giant cell trophoblasts (arrow) with absent to minimal signal. ec – endothelial cell, rbc – red blood cells. Scale bar 200 um. D. Labyrinth spongiotrophoblasts with minimal to mild signal. Scale bar 200 um.
Fig 3
Fig 3
Ectoderm organ systems immunostained for SPL protein with positive cytoplasmic signal, counterstained with hematoxylin. E12: A. cells lining the third ventricle (t) fourth ventricle (o), mesancephalic vesicle (m) and cerebellar primordium (arrowhead). Scale bar 1 mm. B. Rathke’s pouch (arrow). Scale bar 200 um. C. mandibular component of the first brachial arch. Scale bar 400 um. D. epidermis (arrowhead) and neural tube (*). 200 um. E15: E. choroid plexus (arrowhead). Scale bar 800 um. F. olfactory epithelium (*). Scale bar 200 um. G. dorsal root ganglion (arrow). Scale bar 200 um. H. epidermis (arrowhead) and neural tube (*). Scale bar 200 um. E18: I. spinal cord. Scale bar 400 um. J. olfactory epithelium. Scale bar 200 um. K. epidermis (arrowheads). Scale bar 800 um. L. developing pilosebaceous unit (arrowhead). Scale bar 200 um.
Fig 4
Fig 4
Mesoderm organ systems immunostained for SPL protein with positive cytoplasmic signal, counterstained with hematoxylin. E8: A. Amnion (arrows) and yolk sac (YS) with moderate positive signal. Scale bar 800 um. B. Blood island (arrowhead) of yolk sac with positive endothelial lining and positive fetal precursor red blood cells. Scale bar 200 um. C. Amnion (arrow) parietal (arrowhead) and visceral (*) layers of yolk sac with positive signal. Scale bar 200 um. E12: D. Moderately positive signal in myocardium (m), negative in red blood cells (arrowhead). Scale bar 800 um. E15: E. Mild positive signal in myocardium (m), negative in red blood cells (arrowhead). Scale bar 800 um. E18: F. Negative signal in myocardium (m) and red blood cells (arrowhead). Scale bar 800 um. E12: G. Positive signal in primordial thymus (derivative of third brachial arch) (arrow). Scale bar 400 um. E15: H. Minimal scattered positive signal in lymphocytes (arrow) of thymus, but had mild to strong patchy positive signal in thymic epithelial (reticular) cytoplasm (arrowheads), which are derived from endoderm. Scale bar 400 um. E18: I. Negative signal in lymphocytes (arrow) of thymus, but scattered mild to strong positive signal in thymic epithelial (reticular) cytoplasm (arrowheads), which are derived from endoderm. Scale bar 400 um.
Fig 5
Fig 5
Endoderm organ systems immunostained for SPL protein with positive cytoplasmic signal, counterstained with hematoxylin. E12: A. Lung bud with positive signal in cytoplasm of primordial lung epithelium (arrows). Scale bar 400 um. B. Intestinal epithelium with positive cytoplasmic signal (arrow). Scale bar 400 um. C. Higher magnification of B showing signal near apical portion of epithelial cells. Scale bar 200 um. E15: D. Lungs with moderate to strong cytoplasmic signal throughout the tissue. Scale bar 400 um. E. Developing intestinal tract with minimal to mild cytoplasmic staining in future submucosa, muscularis mucosa and serosa (arrows). Scale bar 800 um. F. Higher magnification of E reveals mild cytoplasmic staining in mucosal cells of intestinal tract (arrowhead). Scale bar 200 um. E18: G. Absence of immunohistochemical signal in lung. Scale bar 400 um. H. Minimal cytoplasmic signal in developing submucosa, muscularis mucosa and serosa (arrows). Scale bar 400 um. I. Mild cytoplasmic signal in apical cytoplasm of enterocytes (arrowheads). Scale bar 200 um.

References

    1. Adamson SL, Lu Y, Whiteley KJ, Holmyard D, Hemberger M, Pfarrer C, Cross JC. Interactions between trophoblast cells and the maternal and fetal circulation in the mouse placenta. Dev Biol. 2002;250:358–373. - PubMed
    1. Allende M, Bektas M, Lee B, Bonifacino E, Kang J, Tuymetova G, Chen W, Saba J, Proia R. Sphingosine-1-phosphate lyase deficiency produces a pro-inflammatory response while impairing neutrophil trafficking. J Biol Chem. 2011;286:7348–7358. - PMC - PubMed
    1. Bandhuvula P, Honbo N, Wang GY, Jin ZQ, Fyrst H, Zhang M, Borowsky AD, Dillard L, Karliner JS, Saba JD. S1P lyase: a novel therapeutic target for ischemia-reperfusion injury of the heart. Am J Physiol Heart Circ Physiol. 2011;300:H1753–1761. - PMC - PubMed
    1. Bektas M, Allende ML, Lee BG, Chen W, Amar MJ, Remaley AT, Saba JD, Proia RL. Sphingosine 1-phosphate lyase deficiency disrupts lipid homeostasis in liver. J Biol Chem. 2010;285:10880–10889. - PMC - PubMed
    1. Borowsky AD, Bandhuvula P, Kumar A, Yoshinaga Y, Nefedov M, Fong LG, Zhang M, Baridon B, Dillard L, de Jong P, Young SG, West DB, Saba JD. Sphingosine-1-phosphate lyase expression in embryonic and adult murine tissues. J Lipid Res. 2012;53:1920–1931. - PMC - PubMed

Publication types

Substances

LinkOut - more resources