. 2012 Dec 27:227:247-59.
doi: 10.1016/j.neuroscience.2012.09.049. Epub 2012 Oct 3.

C1 catecholamine neurons form local circuit synaptic connections within the rostroventrolateral medulla of rat

Affiliations

C1 catecholamine neurons form local circuit synaptic connections within the rostroventrolateral medulla of rat

K Agassandian et al. Neuroscience. .

Abstract

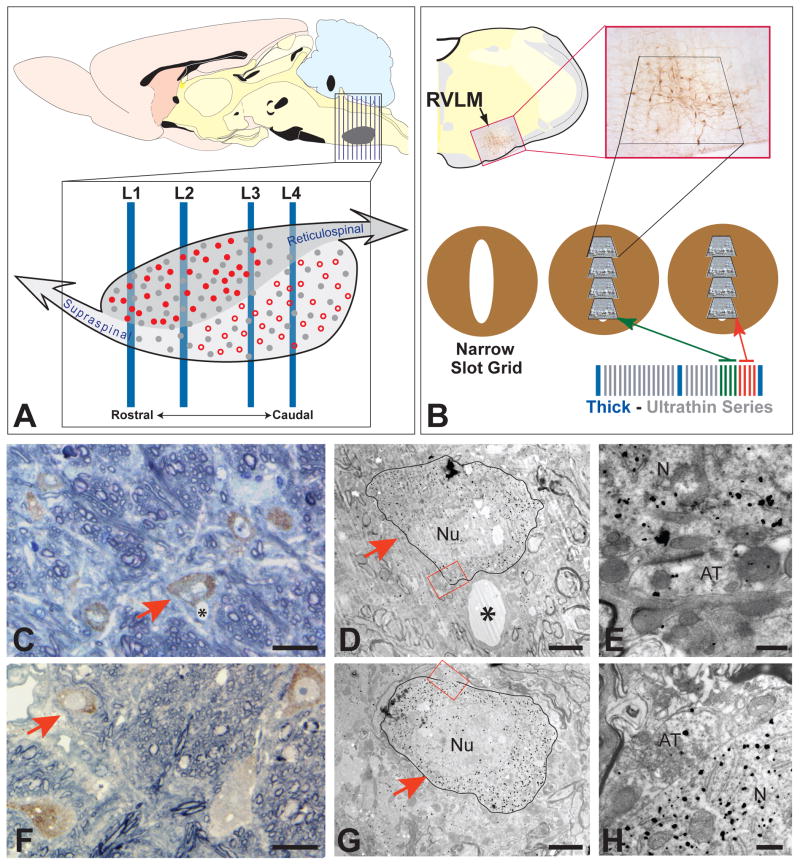
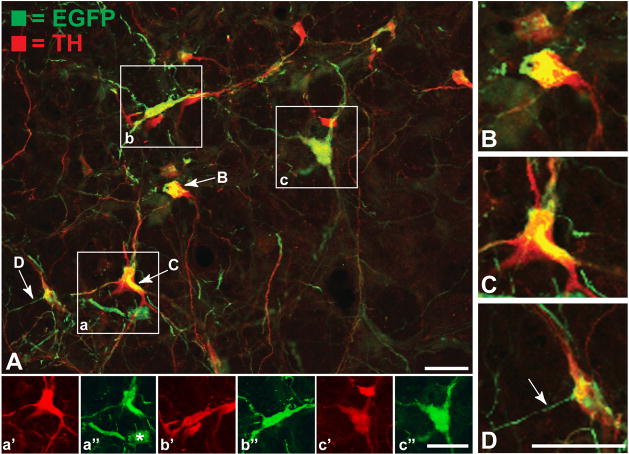
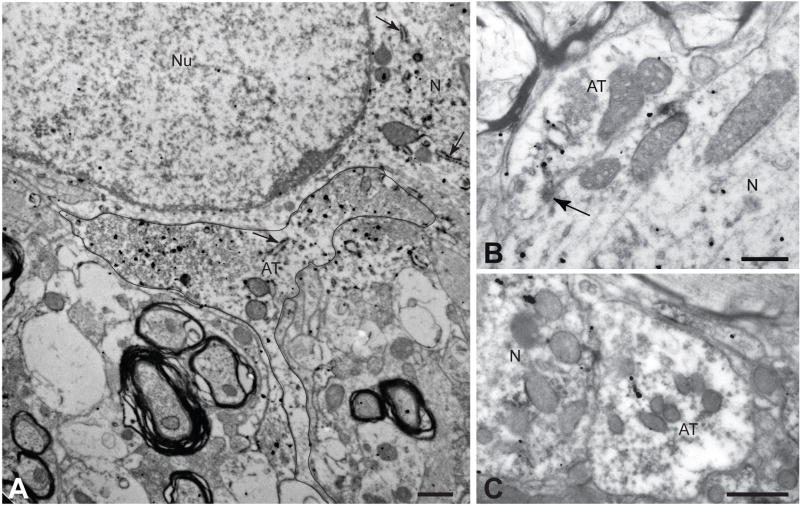
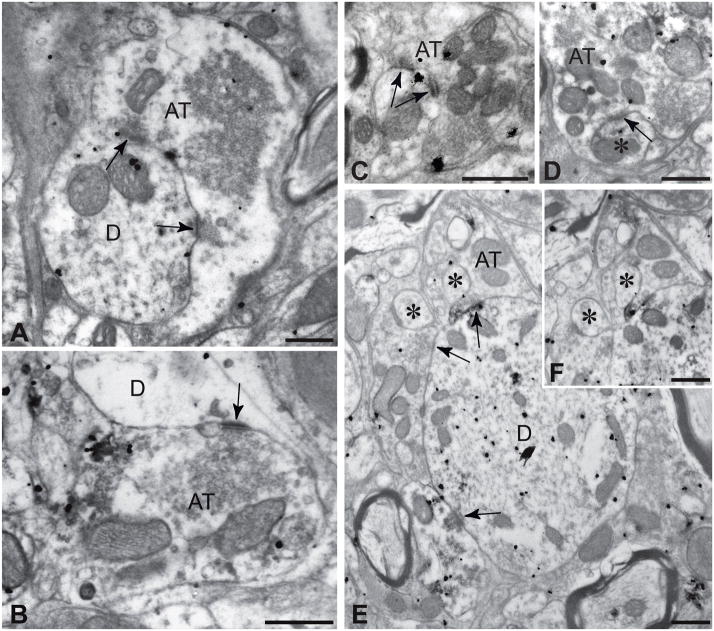
C1 catecholamine neurons reside within the rostroventrolateral medulla (RVLM), an area that plays an integral role in blood pressure regulation through reticulospinal projections to sympathetic preganglionic neurons in the thoracic spinal cord. In a previous investigation we mapped the efferent projections of C1 neurons, documenting supraspinal projections to cell groups in the preautonomic network that contribute to the control of cardiovascular function. Light microscopic study also revealed putative local circuit connections within RVLM. In this investigation we tested the hypothesis that RVLM C1 neurons elaborate a local circuit synaptic network that permits communication between C1 neurons giving rise to supraspinal and reticulospinal projections. A replication defective lentivirus vector that expresses enhanced green fluorescent protein (EGFP) under the control of a synthetic dopamine beta hydroxylase (DβH) promoter was used to label C1 neurons and their processes. Confocal fluorescence microscopy demonstrated thin varicose axons immunopositive for EGFP and tyrosine hydroxylase that formed close appositions to C1 somata and dendrites throughout the rostrocaudal extent of the C1 area. Dual-labeled electron microscopic analysis revealed axosomatic, axodendritic and axospinous synaptic contacts with C1 and non-C1 neurons with a distribution recapitulating that observed in the light microscopic analysis. Labeled boutons were large, contained light axoplasm, lucent spherical vesicles, and formed asymmetric synaptic contacts. Collectively these data demonstrate that C1 neurons form a synaptic network within the C1 area that may function to coordinate activity among projection-specific subpopulations of neurons. The data also suggest that the boundaries of RVLM should be defined on the basis of function criteria rather than the C1 phenotype of neurons.


Figures

Figure 1
Figure 1
The experimental design incorporated in the TEM analysis and data typical of that collected for each case is illustrated. The relative position of the C1 cell group in the brainstem, as well as the four levels of analysis (L1, L2, L3 & L4) selected for TEM sampling, are illustrated schematically in figure 1A. The approximate location of the C1 column is shown by the gray area in the sagittal schematic at the top of A; vertical lines extending through the rostrocaudal extent of the nucleus in that diagram illustrate the extent of coronal vibratome sections collected for analysis. The representation of the C1 cell column shown in the expansion at the bottom of A schematically illustrates the two projection-specific and phenotypically-defined populations of neurons known to populate this region. Filled red circles represent C1 reticulospinal neurons that are concentrated at rostral levels of the nucleus. The open red circles represent C1 neurons that colocalize neuropeptide Y, are concentrated caudally in cell column, and project to supraspinal targets. The filled grey circles represent non-C1 neurons that contribute to both pathways. In figure 1B neurons immunopositive for TH illustrate the position of the C1 column in the ventrolateral medulla and delineate the area cut from the vibratome section for TEM analysis. The lower portion of the schematic illustrates the sectioning strategy incorporated in the analysis to ensure precise localization of labeled profiles within the area of C1. Series of ultrathin sections bracketed by toluidine blue stained thick sections were collected on formvar-coated narrow slot copper grids. Landmarks (e.g., blood vessels, labeled neurons) visible in the thick sections were then identified in the adjacent ultrathin sections and the position of labeled contacts was recorded. Figures C – E and F – H provide two examples of the correlation between light and TEM observations that this approach enabled. The red arrows identify the same labeled neurons in toluidine blue stained sections and the same cells are outlined in adjacent ultrathin sections. The red boxed areas in figures D and G define the location of the axosomatic contacts shown in figures E and H, respectively. See text for a more detailed description. The schematic images in figures A and B are adapted from the Swanson rat brain atlas (Swanson, 1998). AT = axon terminal, N = neuron cytoplasm, Nu = nucleus; asterisks identify blood vessels. Marker bars = 15 μm for A & F, 3 μm for D & G, and 0.5 μm for E & H.
Figure 2
Figure 2
Representative confocal images of immunofluorescence localizations of EGFP (green) and tyrosine hydroxylase (red) in the C1 column are illustrated. Figure 2A is a collapsed projection image of a stack of 24 confocal optical planes obtained near the vector injection site in the rostral portion of RVLM corresponding to L2 in figure 1A. Figures 2B through 2E are higher magnification images of subfields of the stack taken from individual optical planes; the position of each image in the stack is identified in figure 2A. Thin varicose EGFP+ process resembling axons are present within the field and many of the varicose expansions of these axons form intimate appositions with C1 neurons. Axosomatic contacts were distinguished by extremely large varicosities that conformed to the shape of labeled somata. Numerous examples of EGFP+ axons contacting dendrites of C1 neurons were also observed. The boxed areas in figure 2A (labeled a, b & c) are shown in the insets at the bottom of the figure. The red and green color channels for each of the boxed regions are shown separately to illustrate the extent of EGFP and TH colocalization. Quantitative assessment demonstrated that >96% of EGFP+ neurons also exhibited TH immunoreactivity. A small number of neurons exhibited EGFP labeling with no detectable TH (e.g., asterisk labeled cell in 2a′). Such cells were found in the vicinity of the injection site where concentrations of vector were highest. Marker bar = 100 μm for A; the magnification of figure B – D are the same with the marker bar in D = 50 μm; the magnification for the insets below figure 2A is the same with the marker bar in 2c′ = 50 μm.
Figure 3
Figure 3
Electron micrographs of three representative examples of axosomatic contacts between labeled profiles in the C1 column are illustrated. The immunogold label reflects localization of TH and the flocculent electron dense immunoperoxidase label commonly affiliated with cytoplasmic membrane profiles (arrows in 3A) is reflective of EGFP immunoreactivity. The black line traces the plasma membrane of an EGFP/TH+ axon that expands to form a contact with a double labeled C1 neuron. Figures 3B and 3C are through portions of labeled terminals forming axosomatic contacts. The terminal in 3B forms an asymmetric axosomatic synaptic contacts (black arrow) typical of those formed by labeled profiles. Note that the terminals exhibit lucent axoplasm, aggregates of lucent spherical vesicles within the terminal as well as in presynaptic aggregates opposite thickened postsynaptic densities. AT = axon terminal, N = neuron cytoplasm, Nu = nucleus. Marker bars = 0.5 μm.
Figure 4
Figure 4
Electron micrographs demonstrating asymmetric axodendritic (A – C) and axospinous (D – F) synaptic contacts (arrows) between labeled profiles are illustrated. In each case the morphology of terminals recapitulated that observed for axosomatic contacts and all synapses were asymmetric. Axodendritic contacts were observed on all portions of the dendritic tree, including small distal dendrites (C). Although spines (asterisks) were not prolific within our sample, those that were encountered commonly received asymmetric synaptic contacts (D – F). Figure 4F is from a serial section adjacent to the ultrathin section that produced the image in 4E. AT = axon terminal, D = dendrite, asterisks identify spines. Marker bars = 0.5 μm.
Figure 5
Figure 5
Graphical representation of the data from Table 1 demonstrates that appositions and synapses of C1 axons with C1 somata, dendrites, and spines were observed throughout the rostrocaudal extent of the C1 column (A & B). Contacts between labeled axons and non-C1 neurons were also present at all four levels of the rostrocaudal axis (C & D). The numbers in A identify the eight cases included in the TEM analysis and color coding for each case is maintained throughout all of the figures. L1 – L4 on the X axis of figures A through D refers to the four levels of analysis of the C1 column defined in figure 1A. Figure E presents the total number of contacts in all for levels of analysis for each case classified according to postsynaptic target on the X axis (EGFP+ or Unlabeled) and type of contact (apposition or synapse). Note that there was a higher prevalence of synaptic contacts observed between EGFP+ pre- and postsynaptic elements.

References

    1. Abbott SB, Kanbar R, Bochorishvili G, Coates MB, Stornetta RL, Guyenet PG. C1 neurons excite locus coeruleus and A5 noradrenergic neurons along with sympathetic outflow in rats. Journal of Physiology. 2012;590:1–19. - PMC - PubMed
    1. Aicher SA, Kraus JA, Sharma S, Patel A, Milner TA. Selective distribution of mu-opioid receptors in C1 adrenergic neurons and their afferents. Journal of Comparative Neurology. 2001;433:23–33. - PubMed
    1. Barman SM, Gebber GL. Lateral tegmental field neurons of cat medulla: A source of basal activity of ventrolateral medullospinal sympathoexcitatory neurons. Journal of Neurophysiology. 1987;57:1410–1424. - PubMed
    1. Billig I, Foris JM, Enquist LW, Card JP, Yates BJ. Definition of neuronal circuitry controlling the activity of phrenic and abdominal motoneurons in the ferret using recombinant strains of pseudorabies virus. Journal of Neuroscience. 2000;20:7446–7454. - PMC - PubMed
    1. Blessing WW, Hedger SC, Joh TH, Willoughby JO. Neurons in the area postrema are the only catecholamine-synthesizing cells in the medulla or pons with projections to the rostral ventrolateral medulla (C1-area) in the rabbit. Brain Research. 1987;419:336–340. - PubMed

Publication types

MeSH terms

Substances