. 2012 Nov;18(11):1711-5.
doi: 10.1038/nm.2971. Epub 2012 Oct 7.

Computed tomography-based biomarker provides unique signature for diagnosis of COPD phenotypes and disease progression

Affiliations

Computed tomography-based biomarker provides unique signature for diagnosis of COPD phenotypes and disease progression

Craig J Galbán et al. Nat Med. 2012 Nov.

Abstract

Chronic obstructive pulmonary disease (COPD) is increasingly being recognized as a highly heterogeneous disorder, composed of varying pathobiology. Accurate detection of COPD subtypes by image biomarkers is urgently needed to enable individualized treatment, thus improving patient outcome. We adapted the parametric response map (PRM), a voxel-wise image analysis technique, for assessing COPD phenotype. We analyzed whole-lung computed tomography (CT) scans acquired at inspiration and expiration of 194 individuals with COPD from the COPDGene study. PRM identified the extent of functional small airways disease (fSAD) and emphysema as well as provided CT-based evidence that supports the concept that fSAD precedes emphysema with increasing COPD severity. PRM is a versatile imaging biomarker capable of diagnosing disease extent and phenotype while providing detailed spatial information of disease distribution and location. PRM's ability to differentiate between specific COPD phenotypes will allow for more accurate diagnosis of individual patients, complementing standard clinical techniques.


Figures
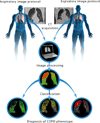
Figure 1
Figure 1. Schematic diagram of the PRM method
PRM is a fundamentally distinct approach from conventional CT-based quantitative measures. This methodology classifies lung attenuation maps on a voxel-by-voxel basis through image co-registration of inspiratory and expiratory images to provide a global measure as well as local distribution and extent of COPD phenotypes. The PRM method consists of four key steps: image acquisition, image processing, quantification and classification. Acquisition of CT scans was performed using imaging protocols that emphasize high resolution with sufficient signal-to-noise on both serial CT scans as defined by the COPDGene Study. Image Processing primarily consists of lung segmentation followed by deformable volumetric registration. Deformable Registration spatially aligns the expiration scan to the inspiration scan such that both share the same spatial geometry. Segmentation of the lung bronchus from the parenchyma is required for further analysis. Classification of voxels from attenuation maps into discrete zones allows for the quantification of global measures of normal parenchyma (PRMNormal, green), functional small airways disease (PRMfSAD, yellow) and emphysema (PRMEmph, red) that is highly sensitive to the extent of COPD as well as retaining spatial information for analysis of the distribution of disease within the lung. The PRM method is a sensitive prognostic imaging biomarker capable of elucidating the complexity and severity of COPD.
Figure 2
Figure 2. COPD phenotypes identified by PRM
The strength of PRM to identify functional small airways disease (PRMfSAD) from emphysema (PRMEmph) is demonstrated in representative sagittal PRM images with corresponding inspiratory and expiratory CT scans from four individuals with varying GOLD status. From the three classifications, normal lung tissue is denoted green, fSAD is denoted yellow, and emphysema is denoted red. Yellow line indicates 5 cm. Additionally, a modified figure has also been provided for easier visualization for those with some forms of color blindness (Supplemental Figure 4).
Figure 3
Figure 3. COPD progression as determined by PRM
A plot of the registered inspiration and expiration CT values for all voxels in the parenchyma provides a signature (i.e. distribution and location of voxel values on a X-Y plot) unique to the COPD severity in the studied subjects. To identify the extent and phenotype of the disease, voxels are classified as normal lung (Green), function small airways disease (fSAD), or emphysema based on two thresholds: 1) −950 HU on inspiration scan (horizontal solid line) with values less denoted emphysema and 2) −856 HU on expiration scan (vertical solid line) with values less denoted gas trapping. (a) Depicted is the distribution of voxels with varying values at inspiration and expiration for an individual with Normal status as determined by spirometry (FEV1/FVC = 83%, FEV1 = 99%). Most of the variation in lung attenuation is observed along the expiration, with voxels generally having less attenuation at expiration than inspiration (right panel presents sagittal slices of CT images at inspiration and expiration). The distribution of voxels generates an elongated elliptical pattern with voxels highly concentrated in the center (red) and decreasing on the periphery (blue). Most voxels are classified as normal lung. (b) A subject with GOLD 4 status (FEV1/FVC = 25, FEV1 = 18) is found to have a signature apart from the Normal status where voxels are classified primarily as fSAD or emphysema. For this subject the PRM signature is less elongated than the pattern observed for the subject without COPD. Similar attenuation on CT scans at inspiration and expiration is observed (right panel), which is characteristic of a subject with extensive emphysema. (c) As observed for the two cases (a and b), a unique attribute of PRM is the distinct signature, distribution and location, of the voxels in the Inspiration-Expiration plots. Calculation of the center of distribution (CoD) that is the median value for both axes (position of the arrows) and principal eigenvector of the data determined by the principal component analysis (arrows) provide information on location and direction of the principal distribution, respectively. A plot of these two metrics for each subject with the three PRM color-codes for COPD are demonstrated. A distinct pattern of COPD progression was revealed suggesting that functional small airways disease (yellow) precedes emphysema (red) in the progression of COPD. Yellow line indicates 5 cm.
Figure 4
Figure 4. PRM as an imaging biomarker of COPD progression
PRM is a highly sensitive technique for identifying the contribution of fSAD and emphysema within an individual. Demonstrated on two subjects, not part of the COPDGene study, is the utility of PRM as an imaging biomarker of disease progression. (a) Serial CT data acquired 325 days apart from an individual identified as GOLD 4 was analyzed by PRM. Within the first CT examination, PRM identified extensive fSAD (PRMfSAD; yellow) and emphysema (PRMEmph; red) throughout the lungs. Analysis of the follow-up CT examination by PRM showed a drop in fSAD and an increase in emphysema suggesting a transition of the disease to a more severe state. Conventional spirometry was unable to observe any changes in the subject’s condition with FEV1(%) of 18% and 17% 11 months later. (b) The main contributing factor of the flow obstruction in an individual with GOLD 2 status was found by PRM to be fSAD and not emphysema. Analysis of follow-up scans by PRM showed a reduction in fSAD (PRMfSAD; yellow) and an improvement in normal lung (PRMNormal; green). This is consistent with the reduction in flow obstruction determined by spirometry with FEV1(%) of 66% to 75% at follow-up. Yellow line indicates 5 cm.

Comment in

References

    1. Buist AS, et al. The Burden of Obstructive Lung Disease Initiative (BOLD): rationale and design. COPD. 2005;2:277–283. - PubMed
    1. Agusti A, Vestbo J. Current Controversies and Future Perspectives in COPD. Am J Respir Crit Care Med. 2011 - PubMed
    1. Regan EA, et al. Genetic epidemiology of COPD (COPDGene) study design. COPD. 2010;7:32–43. - PMC - PubMed
    1. Han MK, et al. Chronic obstructive pulmonary disease phenotypes: the future of COPD. Am J Respir Crit Care Med. 2010;182:598–604. - PMC - PubMed
    1. Gevenois PA, de Maertelaer V, De Vuyst P, Zanen J, Yernault JC. Comparison of computed density and macroscopic morphometry in pulmonary emphysema. Am J Respir Crit Care Med. 1995;152:653–657. - PubMed

Publication types