. 2012 Dec;40(22):11256-69.
doi: 10.1093/nar/gks900. Epub 2012 Oct 4.

LCR 5' hypersensitive site specificity for globin gene activation within the active chromatin hub

Affiliations

LCR 5' hypersensitive site specificity for globin gene activation within the active chromatin hub

Kenneth R Peterson et al. Nucleic Acids Res. 2012 Dec.

Abstract

The DNaseI hypersensitive sites (HSs) of the human β-globin locus control region (LCR) may function as part of an LCR holocomplex within a larger active chromatin hub (ACH). Differential activation of the globin genes during development may be controlled in part by preferential interaction of each gene with specific individual HSs during globin gene switching, a change in conformation of the LCR holocomplex, or both. To distinguish between these possibilities, human β-globin locus yeast artificial chromosome (β-YAC) lines were produced in which the ε-globin gene was replaced with a second marked β-globin gene (β(m)), coupled to an intact LCR, a 5'HS3 complete deletion (5'ΔHS3) or a 5'HS3 core deletion (5'ΔHS3c). The 5'ΔHS3c mice expressed β(m)-globin throughout development; γ-globin was co-expressed in the embryonic yolk sac, but not in the fetal liver; and wild-type β-globin was co-expressed in adult mice. Although the 5'HS3 core was not required for β(m)-globin expression, previous work showed that the 5'HS3 core is necessary for ε-globin expression during embryonic erythropoiesis. A similar phenotype was observed in 5'HS complete deletion mice, except β(m)-globin expression was higher during primitive erythropoiesis and γ-globin expression continued into fetal definitive erythropoiesis. These data support a site specificity model of LCR HS-globin gene interaction.


Figures

Figure 1.
Figure 1.
Schematic of Δε::βm β-YAC constructs in transgenic mice. The 2.9-kb ε-globin gene was replaced with a 4.1-kb βm-globin gene in wt and LCR 5′HS3-deleted β-YACs as described in the ‘Materials and Methods’ section. wt LCR Δε::βm β-YAC, intact LCR; Δ5′HS3 Δε::βm β-YAC, 2.3 kb LCR 5′HS3 deletion (30); Δ5′HS3c Δε::βm β-YAC, 224 bp LCR 5′HS3 core deletion (28). The β-YAC is indicated as a line with the β-like globin genes shown as boxes with the names of the genes above them. Boxes at the left and right ends are modified pYAC4 vector sequences (48). The location of the βm- for ε-globin gene replacement and LCR 5′HS3 deletions are displayed below the line. The LCR 5′HSs, 3′HS1 and YAC/yeast gene components are indicated above the line. TRP1, yeast tryptophan synthesis gene; ARS1, autonomous replicating sequence (yeast origin of replication); CEN1, yeast centromere; LYS2, yeast lysine synthesis gene; MMTneo, mammalian G418-resistance cassette. Restriction enzyme sites are shown below the line and numbered within the human β-globin locus where appropriate (GenBank file U01317).
Figure 2.
Figure 2.
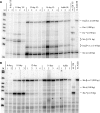
Human β-like globin gene expression during development in Δ5′HS3c Δε::βm β-YAC transgenic mice. (A) Hematopoietic tissues. (B) Blood. RPA was performed as previously described (46,47). Transgenic line 21 is shown here for illustrative purposes. Individual samples are indicated above the autoradiographs, usually by numbers. Developmental stage (days post-conception), tissue (where appropriate), molecular weight markers (M) and control samples (right-side two lanes of autoradiographs) also are shown. Protected fragments and their sizes are indicated on the right. YS, yolk sac; FL, fetal liver; Bl, blood. Hu β ex 2, human β-globin exon 2; Hu βm ex 1, human βm-globin exon 1; Hu ε, human ε-globin; Hu Aγ, human Aγ-globin; Mo α, mouse α-globin; Mo ζ, mouse ζ-globin.
Figure 3.
Figure 3.
βm-globin versus βwt-globin gene expression in Δ5′HS3c Δε::βm β-YAC transgenic mice. RT–PCR coupled with restriction enzyme digestion was carried out as previously described (46) to distinguish marked β-globin (βm) transcripts from wt β-globin (βwt) transcripts. Proof-of-principle data shown are for transgenic line 21. Samples are numbered at the top of the autoradiograph as follows: (1) 8-day yolk sac, (2) 10-day yolk sac, (3) 12-day fetal liver, (4) 14-day fetal liver and (5) adult blood. Uncut, NcoI-digested and ClaI-digested samples also are indicated above the autoradiograph. The uncut PCR product is 360 bp (GenBank HUMHBB 62 138–62 158). NcoI cuts the βwt–globin PCR product into 310 and 50 bp fragments. ClaI cuts the βm-globin PCR product into 310 and 50 bp fragments. Reciprocal digestion does not occur. Restriction enzyme fragment location and sizes are shown on the right.
Figure 4.
Figure 4.
γ- to β-globin gene switching during development in wt and Δ5′HS3c Δε::βm β-YAC transgenic mice. RPA was utilized as described in the ‘Materials and Methods’ section to generate these data. y-axis, percent human globin, [γ/(γ+β) × 100]; x-axis, developmental day, days post-conception or adult. Square and solid line, γ-globin, Δ5′HS3c Δε::βm β-YAC; diamond and dashed line, β-globin, Δ5′HS3c Δε::βm β-YAC; triangle and dotted line, γ-globin, wt β-YAC; circle and dot-dashed line, β-globin, wt β-YAC.
Figure 5.
Figure 5.
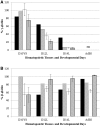
Human β-like globin gene expression during embryonic and definitive erythropoiesis in wt and Δ5′HS3c Δε::βm β-YAC transgenic mice. (A) γ-globin.; (B) β-globin. Light gray, Δ5′HS3c Δε::βm β-YAC; dark gray, wt β-YAC. RPA was performed as described in the ‘Materials and Methods’ section to produce this data for wt β-YAC line 3547 (48) and Δ5′HS3c Δε::βm β-YAC line 21. y-axis, percent Human Globin Gene Expression [(copy number-corrected human γ- or β-globin/copy number-corrected mouse α- + ζ-globin) × 100]; x-axis, developmental day and tissue (see Figures 2 and 4 for legend). Data represent the mean and standard error from two to four biological replicates.
Figure 6.
Figure 6.
γ- and β-globin gene expression in Δ5′HS3c, Δ5′HS3 and wt LCR Δε::βm β-YAC transgenic mice. Semi-quantitative RT–PCR was utilized to measure transcription as referenced in the ‘Materials and Methods’ section. Top panels, Δ5′HS3c Δε::βm β-YAC transgenic lines; middle panels, Δ5′HS3 Δε::βm β-YAC transgenic lines; bottom panels, wt LCR Δε::βm β-YAC (left) or wt β-YAC (right) transgenic lines. Sample numbering: 1, 10-day yolk sac; 2, 12-day fetal liver; 3, 14-day fetal liver; 4, adult blood. PCR products and sizes are indicated to the right of some panels (Figure 2 for labeling conventions). Data shown are representative experiments used to generate Tables 1–4.
Figure 7.
Figure 7.
Normalized γ- and β-globin gene expression levels in wt β-YAC, Δ5′HS3c, Δ5′HS3 and wt LCR Δε::βm β-YAC transgenic mice. Averages for each transgenic mouse line from Tables 2 and 4 were averaged and graphed with standard deviations. x- and y-axes are as described in Figure 5. Black bars, wt β-YAC; gray bars, wt LCR Δε::βm β-YAC; white bars, Δ5′HS3 Δε::βm β-YAC; hatched bars, Δ5′HS3c Δε::βm β-YAC. (A) γ-Globin; (B) β-globin. γ-Globin gene expression levels between the Δ5′HS3 and Δ5′HS3c lines were analyzed by a two-tailed t-test at the different developmental days; no significant differences were found. A two-tailed t-test revealed that β-globin gene expression in the Δ5′HS3c lines was significantly higher compared with the Δ5′HS3 lines at Day 14 and adult stage (P = 0.011 and 0.0006, respectively).
Figure 8.
Figure 8.
βm- and βwt-globin gene expression in Δ5′HS3c, Δ5′HS3 and wt LCR Δε::βm β-YAC transgenic mice. Semi-quantitative RT–PCR coupled with restriction enzyme digestion was used as outlined in the legends to Figures 3 and 7. Labeling conventions are also the same as for those figures. Panels A and B are two representative experiments to show sample data employed to generate Tables 1–4. Sample numbering: 1, 10-day yolk sac; 2, 12-day fetal liver; 3, 14-day fetal liver; 4, adult blood.
Figure 9.
Figure 9.
Model for LCR 5′HS3 gene activation specificity. These illustrations emphasize the interaction of 5′HS3 with a specific globin gene at each developmental stage. Panels A–C represent the interaction of the intact wt LCR with the ε- and γ-globin genes during primitive erythropoiesis (panels A and B) and fetal definitive erythropoiesis (panel C). Panels D–F represent the interaction of the 5′HS3 mutant LCRs with the ε- and γ-globin genes during primitive erythropoiesis (panels D and E) and fetal definitive erythropoiesis (panel F). Panel D shows the effect of the Δ5′HS3 on ε- and γ-globin during primitive erythropoiesis; panels E and F show the effect of the 5′ΔHS3c on these two genes during primitive erythropoiesis and fetal definitive erythropoiesis, respectively. For each panel, the developmental stage and globin gene are indicated at the top. The intact 5′HS3 is shown as a black oval (panels A–C), the complete 5′HS3 deletion (Δ5′HS3) is indicated by a missing oval (panel D) and the Δ5′HS3c is displayed as a hatched oval (panels E and F). The ε- and γ-globin genes are shown as rectangles; the darker color shade for each gene represents the promoter. (A) In the embryonic yolk sac, LCR 5′HS3 is essential for activation of ε-globin gene expression. (B) LCR 5′HS3 is not required for interaction with the γ-globin genes; another LCR 5′HS may be necessary. (C) In the fetal liver, LCR 5′HS3 is essential for activation of γ-globin gene expression. For the complete 5′HS3 and 5′ΔHS3c deletions [(D) and (E), respectively], γ-globin is expressed normally in yolk sac because the 5′HS3-mutated LCRs cannot interact with the ε-globin gene. However, LCR 5′HS3 is required for γ-globin expression during fetal definitive hematopoiesis (F), and in the absence of the 5′HS3 core region, γ-globin levels are markedly reduced. Altogether, this model suggests that HS site-specificity for gene activation is an important determinant of correct developmental expression of the β-like globin genes.

Similar articles

Cited by

References

    1. Stamatoyannopoulos G, Grosveld F. Hemoglobin switching. In: Stamatoyannopoulos G, Majerus PW, Perlmutter RM, Varmus H, editors. The Molecular Basis of Blood Diseases. 3rd edn. Philadelphia, PA: W.B. Saunders; 2001. pp. 135–182.
    1. Harju S, McQueen KJ, Peterson KR. Chromatin structure and control of β-like globin gene switching. Exp. Biol. Med. 2002;227:683–700. - PubMed
    1. Noordermeer D, de Laat W. Joining the loops: β-globin gene regulation. IUBMB Life. 2008;60:824–833. - PubMed
    1. Tuan D, Solomon W, Li Q, London IM. The “β-like-globin” gene domain in human erythroid cells. Proc. Natl Acad. Sci. USA. 1985;82:6384–6388. - PMC - PubMed
    1. Forrester WC, Thompson C, Elder JT, Groudine M. A developmentally stable chromatin structure in the human β-globin gene cluster. Proc. Natl Acad. Sci. USA. 1986;83:1359–1363. - PMC - PubMed

Publication types