

Reverse engineering and analysis of large genome-scale gene networks
- PMID: 23042249
- PMCID: PMC3592423
- DOI: 10.1093/nar/gks904
Reverse engineering and analysis of large genome-scale gene networks
Abstract
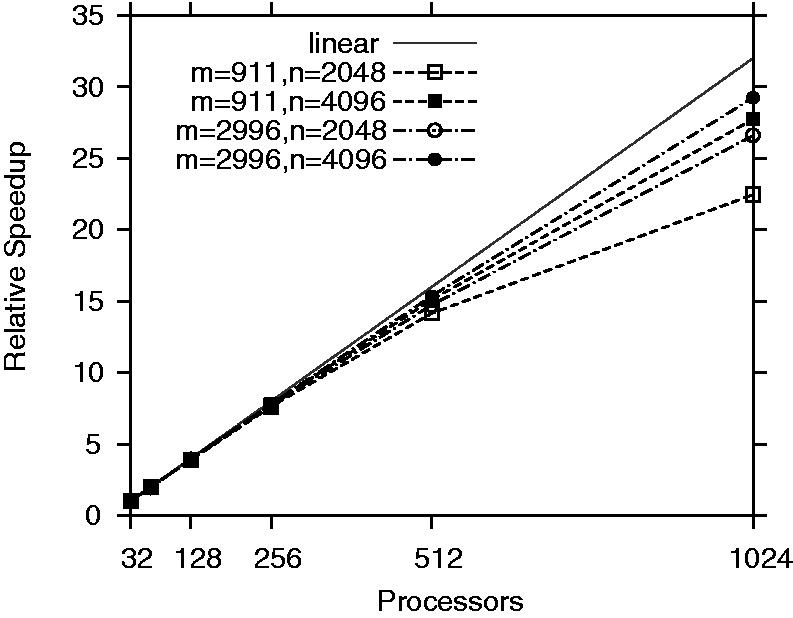
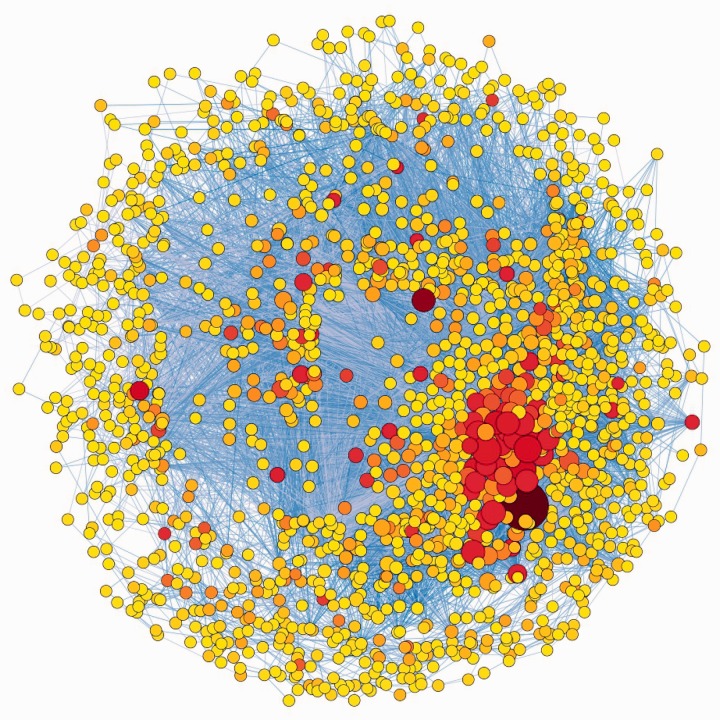
Reverse engineering the whole-genome networks of complex multicellular organisms continues to remain a challenge. While simpler models easily scale to large number of genes and gene expression datasets, more accurate models are compute intensive limiting their scale of applicability. To enable fast and accurate reconstruction of large networks, we developed Tool for Inferring Network of Genes (TINGe), a parallel mutual information (MI)-based program. The novel features of our approach include: (i) B-spline-based formulation for linear-time computation of MI, (ii) a novel algorithm for direct permutation testing and (iii) development of parallel algorithms to reduce run-time and facilitate construction of large networks. We assess the quality of our method by comparison with ARACNe (Algorithm for the Reconstruction of Accurate Cellular Networks) and GeneNet and demonstrate its unique capability by reverse engineering the whole-genome network of Arabidopsis thaliana from 3137 Affymetrix ATH1 GeneChips in just 9 min on a 1024-core cluster. We further report on the development of a new software Gene Network Analyzer (GeNA) for extracting context-specific subnetworks from a given set of seed genes. Using TINGe and GeNA, we performed analysis of 241 Arabidopsis AraCyc 8.0 pathways, and the results are made available through the web.
Figures
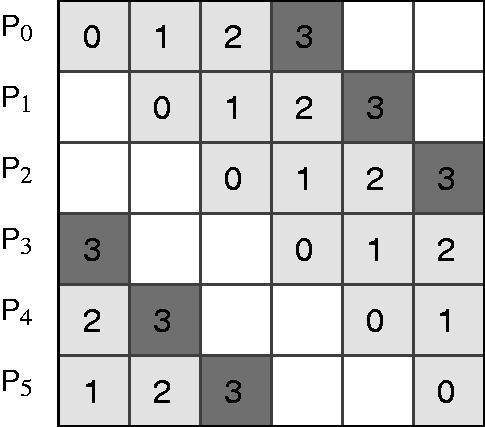
 adjacency matrix D, where n is the number of genes. The matrix is partitioned into
  blocks of submatrices as shown. Each processor is assigned a row of submatrices. The number inside a submatrix indicates the stage at which the submatrix is computed. Only half the matrix is computed as it is symmetric.
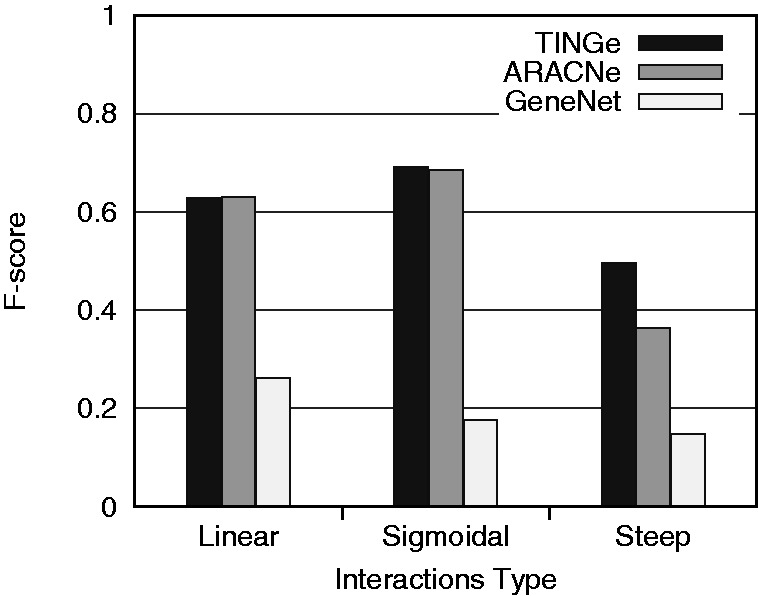
References
-
- Schafer J, Strimmer K. An empirical Bayes approach to inferring large-scale gene association networks. Bioinformatics. 2005;21:754–764. - PubMed
