

Ephrin-B2 reverse signaling is required for topography but not pattern formation of lateral superior olivary inputs to the inferior colliculus
- PMID: 23042409
- PMCID: PMC4019236
- DOI: 10.1002/cne.23243
Ephrin-B2 reverse signaling is required for topography but not pattern formation of lateral superior olivary inputs to the inferior colliculus
Abstract
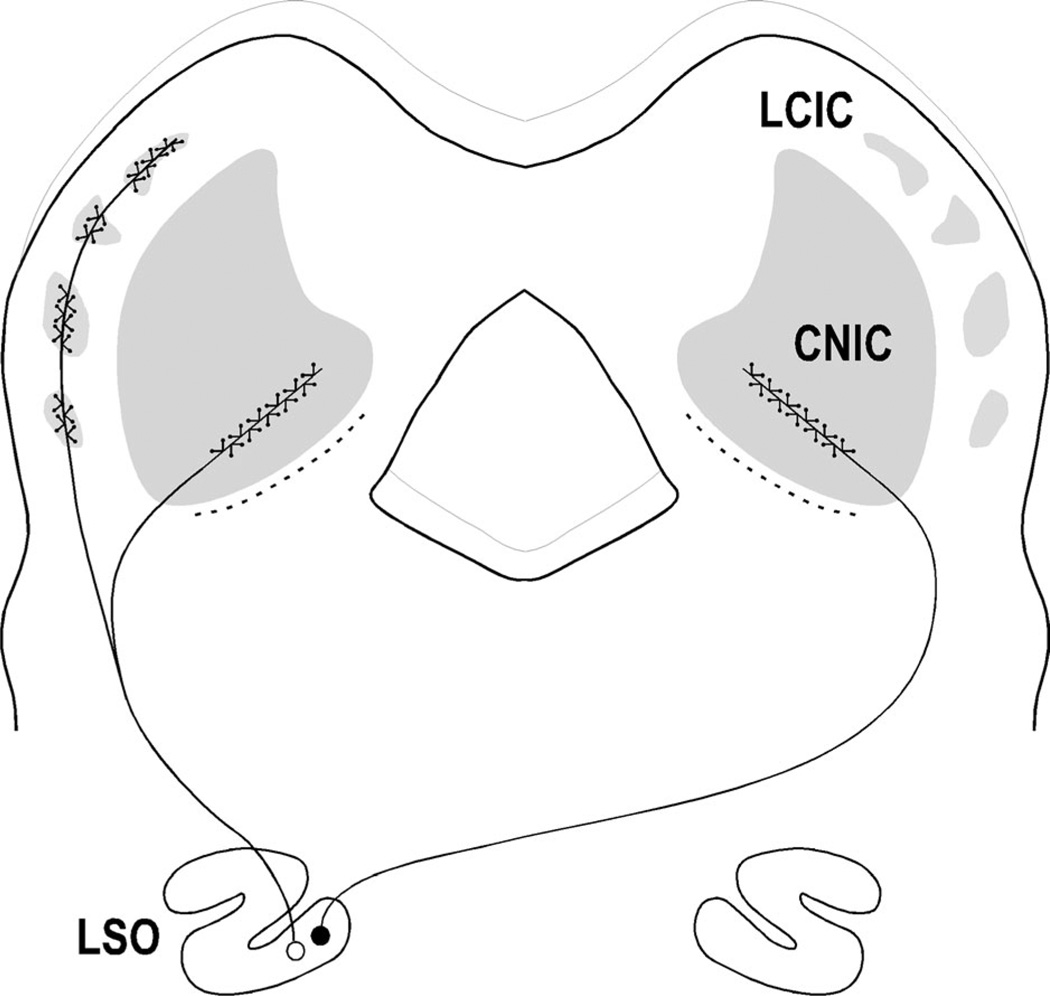
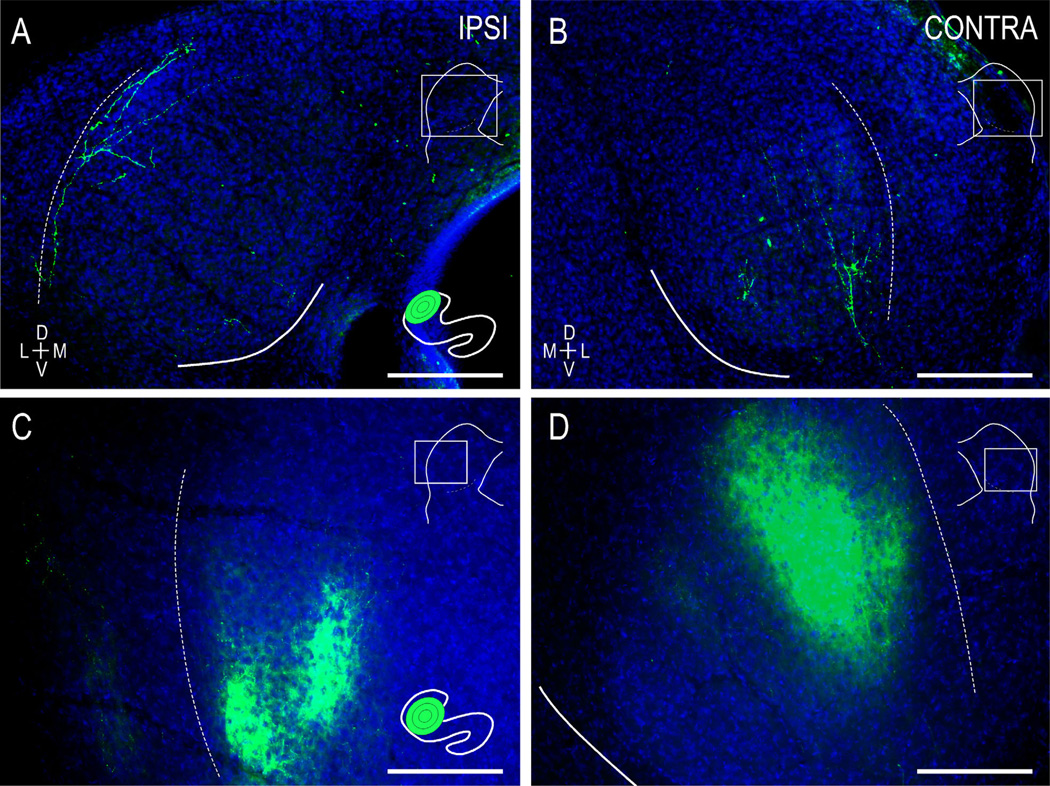
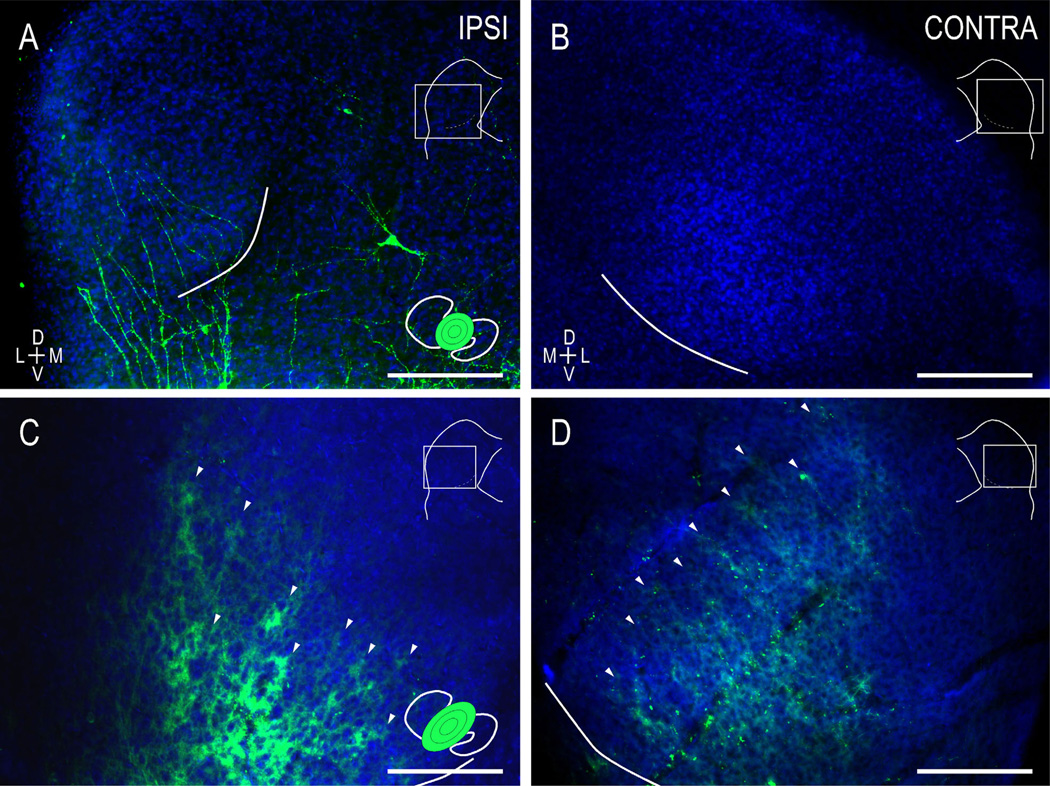
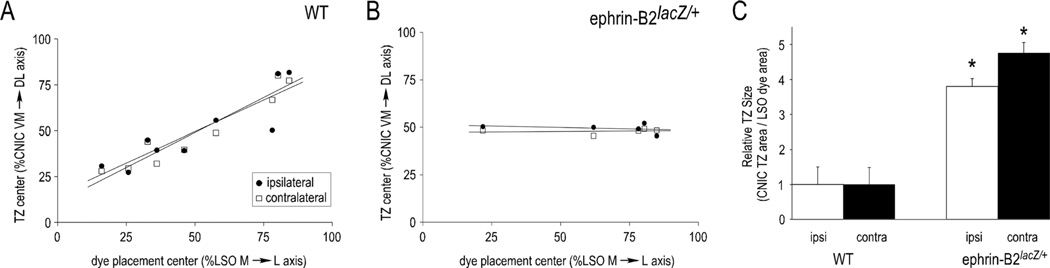
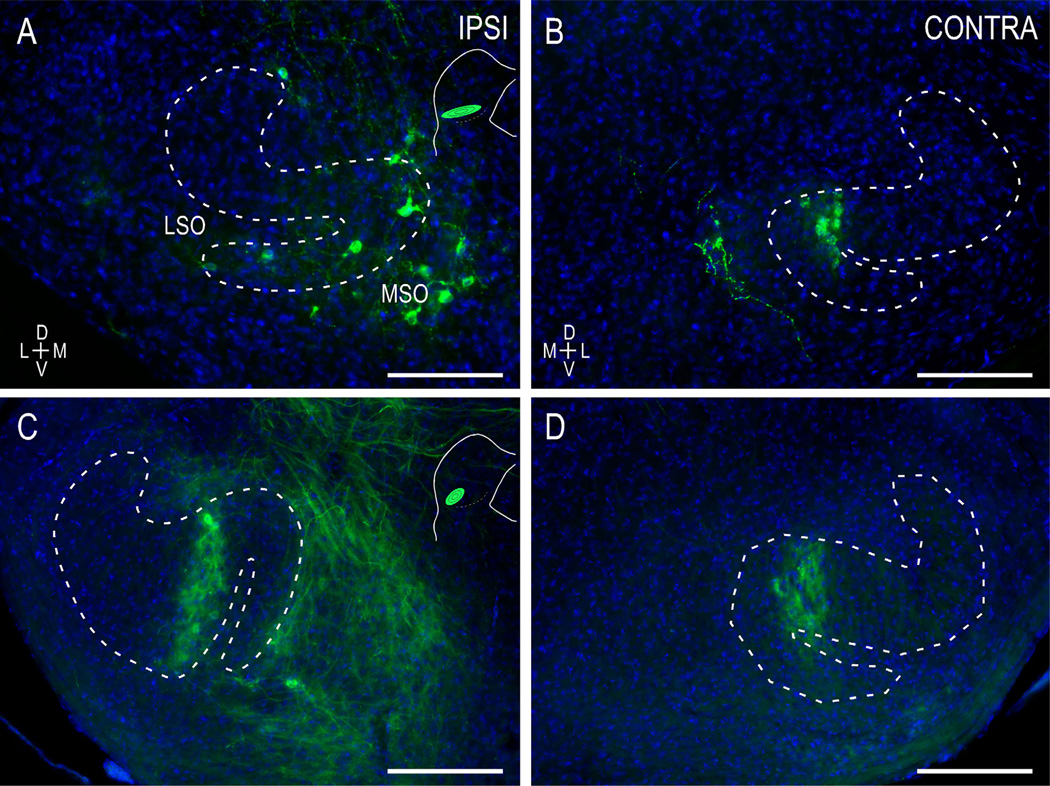
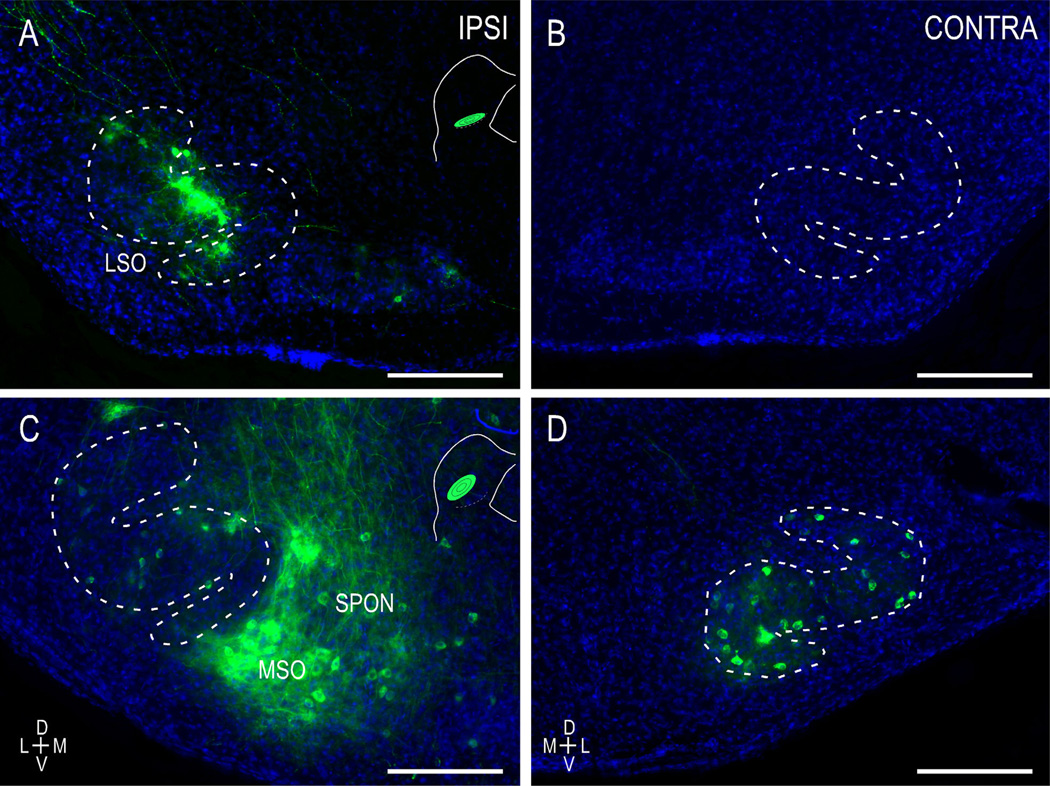
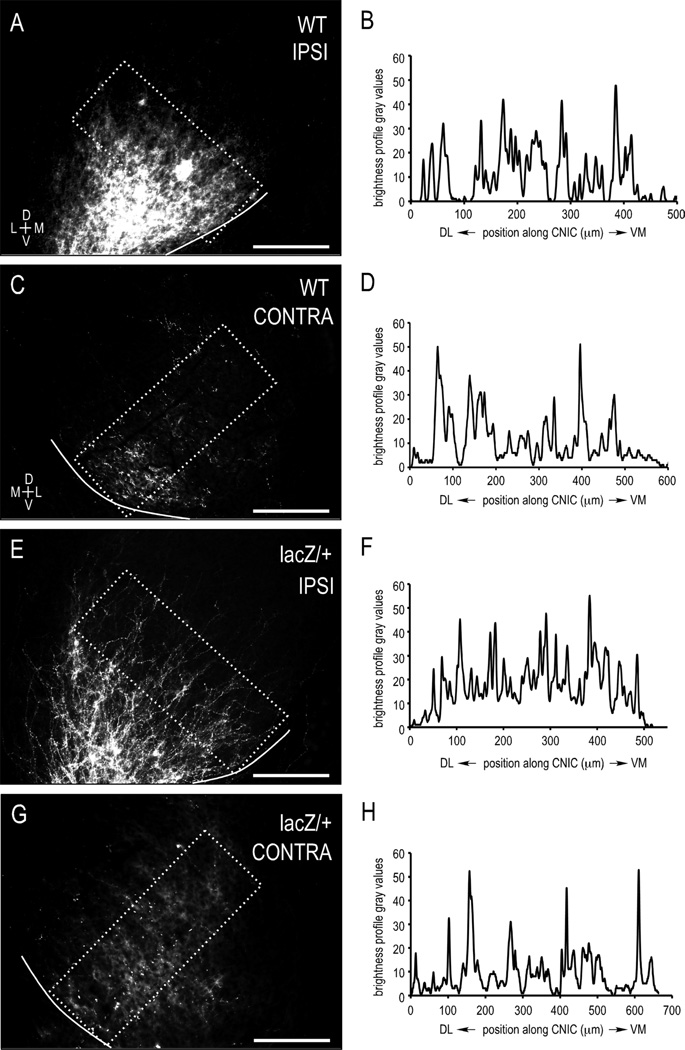
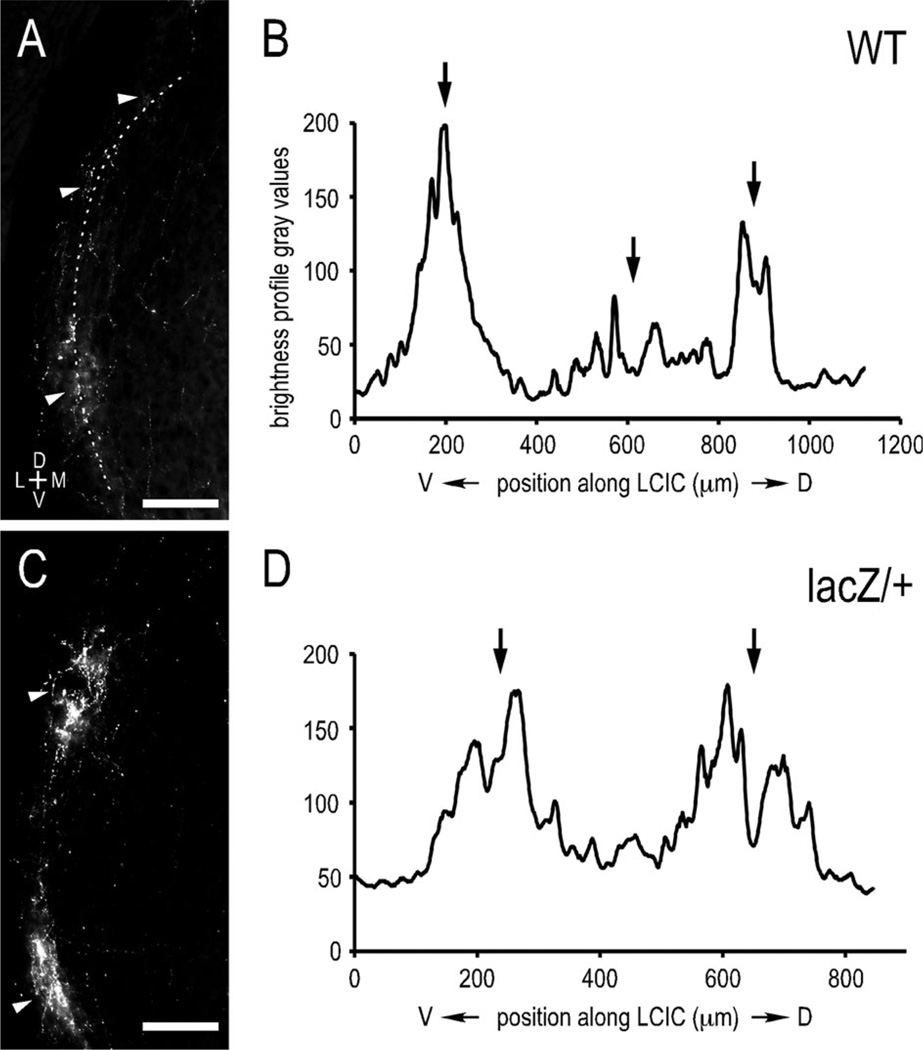
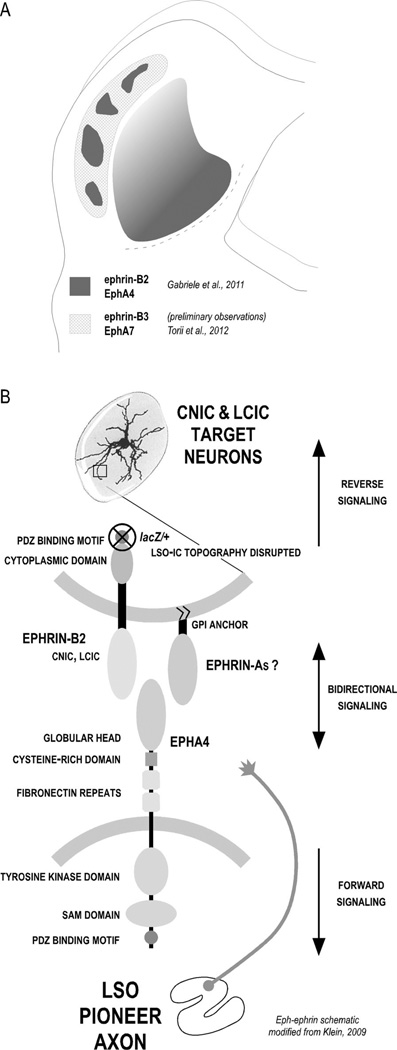
Graded and modular expressions of Eph-ephrins are known to provide positional information for the formation of topographic maps and patterning in the developing nervous system. Previously we have shown that ephrin-B2 is expressed in a continuous gradient across the tonotopic axis of the central nucleus of the inferior colliculus (CNIC), whereas patterns are discontinuous and modular in the lateral cortex of the IC (LCIC). The present study explores the involvement of ephrin-B2 signaling in the development of projections to the CNIC and LCIC arising from the lateral superior olivary nuclei (LSO) prior to hearing onset. Anterograde and retrograde fluorescent tracing methods in neonatal fixed tissue preparations were used to compare topographic mapping and the establishment of LSO layers/modules in wild-type and ephrin-B2(lacZ/+) mice (severely compromised reverse signaling). At birth, pioneer LSO axons occupy the ipsilateral IC in both groups but are delayed contralaterally in ephrin-B2(lacZ/+) mutants. By the onset of hearing, both wild-type and mutant projections form discernible layers bilaterally in the CNIC and modular arrangements within the ipsilateral LCIC. In contrast, ephrin-B2(lacZ/+) mice lack a reliable topography in LSO-IC projections, suggesting that fully functional ephrin-B2 reverse signaling is required for normal projection mapping. Taken together, these ephrin-B2 findings paired with known coexpression of EphA4 suggest the importance of these signaling proteins in establishing functional auditory circuits prior to experience.
Copyright © 2012 Wiley Periodicals, Inc.
Conflict of interest statement
The authors have no conflict of interest.
Figures
Similar articles
-
Graded and discontinuous EphA-ephrinB expression patterns in the developing auditory brainstem.Hear Res. 2016 May;335:64-75. doi: 10.1016/j.heares.2016.02.013. Epub 2016 Feb 21. Hear Res. 2016. PMID: 26906676 Free PMC article.
-
EphA4 and ephrin-B2 expression patterns during inferior colliculus projection shaping prior to experience.Dev Neurobiol. 2011 Feb;71(2):182-99. doi: 10.1002/dneu.20842. Dev Neurobiol. 2011. PMID: 20886601
-
Alignment of EphA4 and ephrin-B2 expression patterns with developing modularity in the lateral cortex of the inferior colliculus.J Comp Neurol. 2018 Nov 1;526(16):2706-2721. doi: 10.1002/cne.24525. Epub 2018 Oct 22. J Comp Neurol. 2018. PMID: 30156295 Free PMC article.
-
Ascending efferent projections of the superior olivary complex.Microsc Res Tech. 2000 Nov 15;51(4):355-63. doi: 10.1002/1097-0029(20001115)51:4<355::AID-JEMT5>3.0.CO;2-J. Microsc Res Tech. 2000. PMID: 11071719 Review.
-
Eph and ephrin signaling in the development of the central auditory system.Dev Dyn. 2023 Jan;252(1):10-26. doi: 10.1002/dvdy.506. Epub 2022 Jun 24. Dev Dyn. 2023. PMID: 35705527 Free PMC article. Review.
Cited by
-
Development of intrinsic connectivity in the central nucleus of the mouse inferior colliculus.J Neurosci. 2014 Nov 5;34(45):15032-46. doi: 10.1523/JNEUROSCI.2276-14.2014. J Neurosci. 2014. PMID: 25378168 Free PMC article.
-
Registry of Compartmental Ephrin-B3 Guidance Patterns With Respect to Emerging Multimodal Midbrain Maps.Front Neuroanat. 2021 Mar 16;15:649478. doi: 10.3389/fnana.2021.649478. eCollection 2021. Front Neuroanat. 2021. PMID: 33815071 Free PMC article.
-
Graded and discontinuous EphA-ephrinB expression patterns in the developing auditory brainstem.Hear Res. 2016 May;335:64-75. doi: 10.1016/j.heares.2016.02.013. Epub 2016 Feb 21. Hear Res. 2016. PMID: 26906676 Free PMC article.
-
Segregation of Multimodal Inputs Into Discrete Midbrain Compartments During an Early Critical Period.Front Neural Circuits. 2022 Apr 7;16:882485. doi: 10.3389/fncir.2022.882485. eCollection 2022. Front Neural Circuits. 2022. PMID: 35463204 Free PMC article.
-
Ephrin-B2/EphA4 forward signaling is required for regulation of radial migration of cortical neurons in the mouse.Neurosci Bull. 2014 Jun;30(3):425-32. doi: 10.1007/s12264-013-1404-1. Epub 2014 Jan 29. Neurosci Bull. 2014. PMID: 24477991 Free PMC article.
References
-
- Chernock ML, Larue DT, Winer JA. A periodic network of neurochemical modules in the inferior colliculus. Hear Res. 2004;188:12–20. - PubMed
-
- Coleman JR, Clerici WJ. Sources of projections to subdivisions of the inferior colliculus in rat. J Comp Neurol. 1987;262:215–226. - PubMed
-
- Cowan CA, Henkemeyer M. Ephrins in reverse, park and drive. Trends Cell Biol. 2002;12:339–346. - PubMed
-
- Cramer KS. Eph proteins and the assembly of auditory circuits. Hear Res. 2005;206:42–51. - PubMed
-
- Cutforth T, Moring L, Mendelsohn M, Nemes A, Shah NM, Kim MM, Frisén J, Axel R. Axonal ephrin-As and odorant receptors: coordinate determination of the olfactory sensory map. Cell. 2003;114:311–322. - PubMed
Publication types
MeSH terms
Substances
Grants and funding
LinkOut - more resources
Full Text Sources
Other Literature Sources
Molecular Biology Databases
Miscellaneous
