. 2012 Oct:Chapter 12:Unit12.9.
doi: 10.1002/0471142956.cy1209s62.

Live-animal imaging of renal function by multiphoton microscopy

Affiliations

Live-animal imaging of renal function by multiphoton microscopy

Kenneth W Dunn et al. Curr Protoc Cytom. 2012 Oct.

Abstract

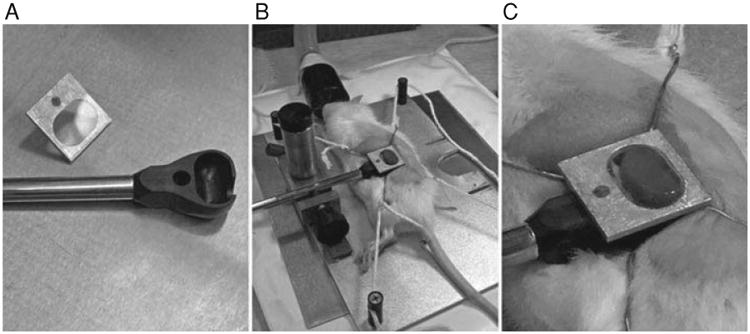
Intravital microscopy, microscopy of living animals, is a powerful research technique that combines the resolution and sensitivity found in microscopic studies of cultured cells with the relevance and systemic influences of cells in the context of the intact animal. The power of intravital microscopy has recently been extended with the development of multiphoton fluorescence microscopy systems capable of collecting optical sections from deep within the kidney at subcellular resolution, supporting high-resolution characterizations of the structure and function of glomeruli, tubules, and vasculature in the living kidney. Fluorescent probes are administered to an anesthetized, surgically prepared animal, followed by image acquisition for up to 3 hr. Images are transferred via a high-speed network to specialized computer systems for digital image analysis. This general approach can be used with different combinations of fluorescent probes to evaluate processes such as glomerular permeability, proximal tubule endocytosis, microvascular flow, vascular permeability, mitochondrial function, and cellular apoptosis/necrosis.


Figures

Figure 12.9.1
Figure 12.9.1
Intravital assay of glomerular permeability. This figure shows a multiphoton fluorescence optical section of the kidney of a living rat injected with Hoechst 33342 to label nuclei (blue), a 500-Kda dextran–Alexa 488 (green) that is retained in the vasculature, and a 5-Kda dextran-rhodamine (red) that is rapidly filtered, appearing first in the Bowman's space (center), then in the proximal tubules (top), and finally concentrating in the distal tubules (bottom left). The field of view is 200 μm across. For the color version of this figure go to http://www.currentprotocols.com/protocol/cy1209.
Figure 12.9.2
Figure 12.9.2
Intravital assay of proximal tubule endocytosis. This figure shows a projection of multiphoton fluorescence images of the kidney of a living rat injected with Hoechst 33342 and a 3000-Da dextran–Cascade Blue, and then with a 3000-Da dextran–Texas Red 1 hr later. The image shown was collected 10 min following injection of the dextran-Texas Red. In this image, the Texas Red–dextran has progressed only as far as early endosomes, distributed in the apex of the proximal tubule cells (red puncta), whereas the Cascade Blue–dextran is seen in distinct, basally localized compartments, reflecting the progression of this probe into later endocytic and lysosomal compartments. Note the absence of endocytic uptake by the epithelial cells of the distal tubule on the right. Scale bar is 20 μm. For the color version of this figure go to http://www.currentprotocols.com/protocol/cy1209.
Figure 12.9.3
Figure 12.9.3
Measurement of microvascular blood flow. Rhodamine-labeled albumin was infused by bolus injection into the jugular vein of an animal, and an area of interest in the kidney was imaged by multiphoton microscopy. (A) A line scan was performed along the central axis of the vessel of interest (white line) continuously at a rate of 2 msec per line for 1 sec (500 lines total). Flowing red blood cells, which exclude the fluorescent probe, appear as black objects. (B) The line scans were combined into a single image in B, resulting in an image in which the vertical axis represents time (the 1-sec interval of line-scan collection), and the horizontal axis represents distance (the length of the scan). Thus, the dark lines in panel B reflect the passage of blood cells along the linescan over time, and the velocity of each can be determined by measuring the slope of the line (Δdt) as described by Kang et al. (2006). Field of view is 70-μm across.
Figure 12.9.4
Figure 12.9.4
Measurement of vascular permeability. (A) A rhodamine-labeled (red) dextran (500,000 Da) was infused by bolus injection into the jugular vein of an animal and a renal microvessel of interest was imaged by multiphoton microscopy to determine the vascular space. This was followed by the bolus injection of a fluorescein (green)-dextran (10,000 Da). The vessel of interest was imaged every 0.45 sec after injection of the fluorescein-dextran. (B) Representative image from this time series. The permeability of the vessel can be measured by integrating the fluorescence intensity along a line perpendicular to the vessel as described by Brown et al. (2001). Indicated lines reflect a distance of 3 μm. For the color version of this figure go to http://www.currentprotocols.com/protocol/cy1209.
Figure 12.9.5
Figure 12.9.5
Intravital assay of mitochondrial function. Metabolically active mitochondria of vascular and circulating cells can be labeled by intravenous injection of rhodamine B hexyl ester. In this figure, mitochondrial accumulation is seen as bright red labeling adjacent to the characteristically flattened nuclei of the endothelia of the intertubular capillaries (arrowheads), many of which have been imaged en face in this optical section (ef), and glomerular capillaries (arrow). The vasculature was labeled with a large 500,000-Da fluorescein-dextran, nuclei were labeled with Hoechst 33342, and the proximal tubules above and below the glomerulus were previously labeled with 3,000-Da dextran–Texas Red and dextran–Cascade Blue, sequentially, giving the unique staining pattern. (Bar = 10 μm). For the color version of this figure go to http://www.currentprotocols.com/protocol/cy1209.
Figure 12.9.6
Figure 12.9.6
Apoptosis and necrosis. Apoptotic cells can be identified by their characteristically fragmented nuclear morphology, using Hoechst 33342 to fluorescently label nuclei. (A) Optical section collected from a living rat previously given a cecal ligation and puncture injury. This animal was injected with Hoechst, as well as a large green dextran (labeling vasculature) and a small red dextran (labeling tubule lumens and endosomes). Arrows indicate a few of the apoptotic tubular cells imaged in this field. (B) Corresponding image from an untreated animal. The nuclei in this image are characteristically regular in shape, and labeled less intensely with Hoechst 33342. Fields are 100 μm in diameter. For the color version of this figure go to http://www.currentprotocols.com/protocol/cy1209.
Figure 12.9.7
Figure 12.9.7
A schematic diagram of the arrangement for imaging a living rodent on an inverted microscope. The kidney of a living rat or mouse can be imaged on an inverted microscope stand by placing the kidney into an isotonic saline–filled 50-mm cell-culture dish whose bottom has been replaced with a no. 1.5 coverslip. As shown, the rat lies on its side on a heated microscope stage, wrapped in a heating pad. (Two Repti Therm heating pads placed beneath the head and legs are not shown). The kidney is thus gently pressed against the coverslip, so that it may be imaged by the objective located below the microscope stage.
Figure 12.9.8
Figure 12.9.8
In order to image the kidney of a living animal with an upright microscope, the kidney must be supported in a kidney cup. The kidney cup can be fashioned out of thin plastic or metal. It is critical that the cup be small enough to fit within the animal and positioned around the kidney in such a way that blood flow to the kidney is not significantly altered (i.e., by placing excessive tension on the renal pedicle). (A) The kidney cup (black) is mounted on a support rod. A coverglass, mounted on an aluminum bracket, is attached to the top of the cup, after insertion of the kidney. (B) Following surgery, the kidney of a living rat is placed into the kidney cup, whose support rod is attached to an adjustable support structure. (C) Close-up of the kidney cup in position.

References

    1. Brown EB, Campbell RB, Tsuzuki Y, Xu L, Carmeliet P, Fukumura D, Jain RK. In vivo measurement of gene expression, angiogenesis and physiological function in tumors using multiphoton laser scanning microscopy. Nat Med. 2001;7:864–868. - PubMed
    1. Cahalan MD, Parker I. Imaging the choreography of lymphocyte trafficking and the immune response. Curr Opin Immunol. 2006;18:476–482. - PMC - PubMed
    1. Centonze VE, White JG. Multiphoton excitation provides optical sections from deeper within scattering specimens than confocal imaging. Biophys J. 1998;75:2015–2024. - PMC - PubMed
    1. Condeelis J, Segall JE. Intravital imaging of cell movement in tumours. Nat Rev Cancer. 2003;3:921–930. - PubMed
    1. Denk W, Svoboda K. Photon upmanship: Why multiphoton imaging is more than a gimmick. Neuron. 1997;18:351–357. - PubMed

Substances

LinkOut - more resources