. 2014 Jan;24(1):81-97.
doi: 10.1093/cercor/bhs287. Epub 2012 Oct 4.

Temporal coupling with cortex distinguishes spontaneous neuronal activities in identified basal ganglia-recipient and cerebellar-recipient zones of the motor thalamus

Affiliations

Temporal coupling with cortex distinguishes spontaneous neuronal activities in identified basal ganglia-recipient and cerebellar-recipient zones of the motor thalamus

Kouichi C Nakamura et al. Cereb Cortex. 2014 Jan.

Abstract

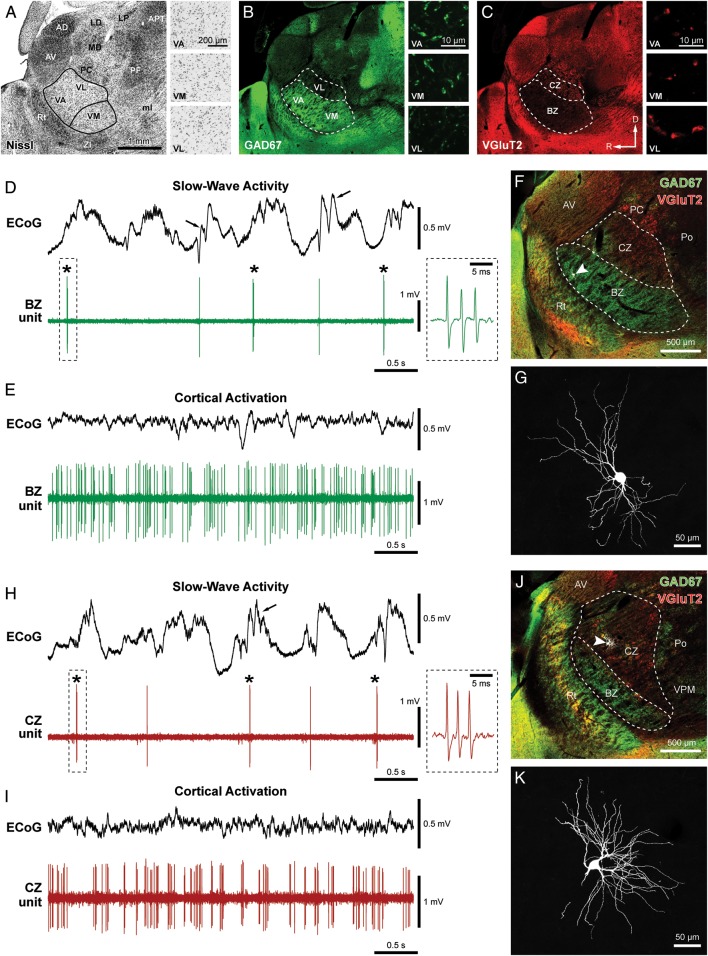
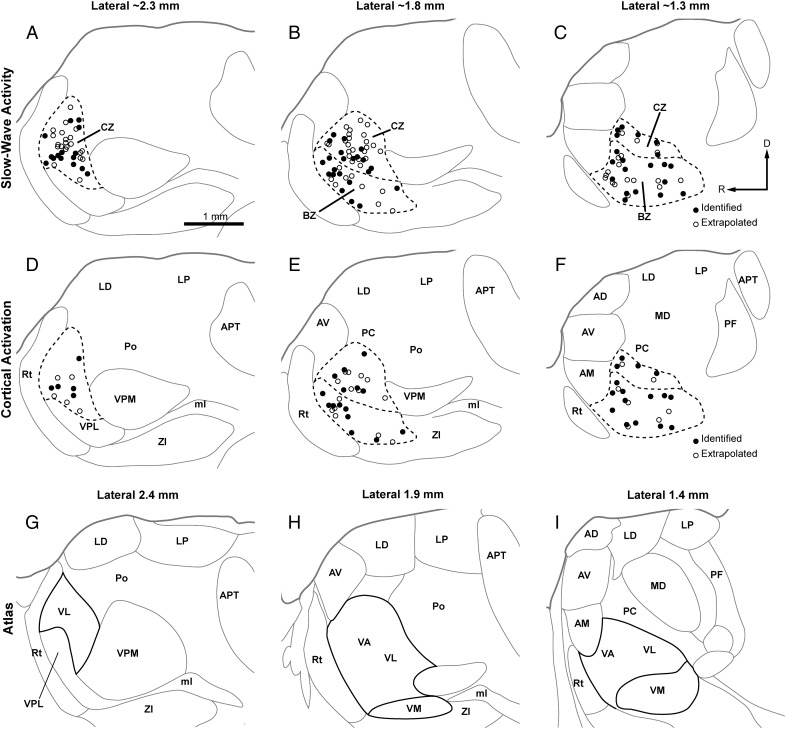
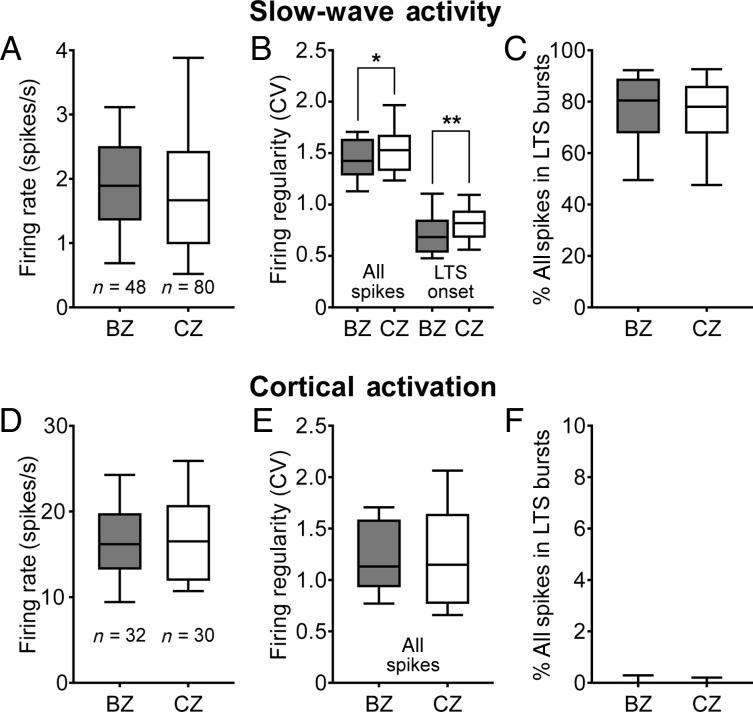
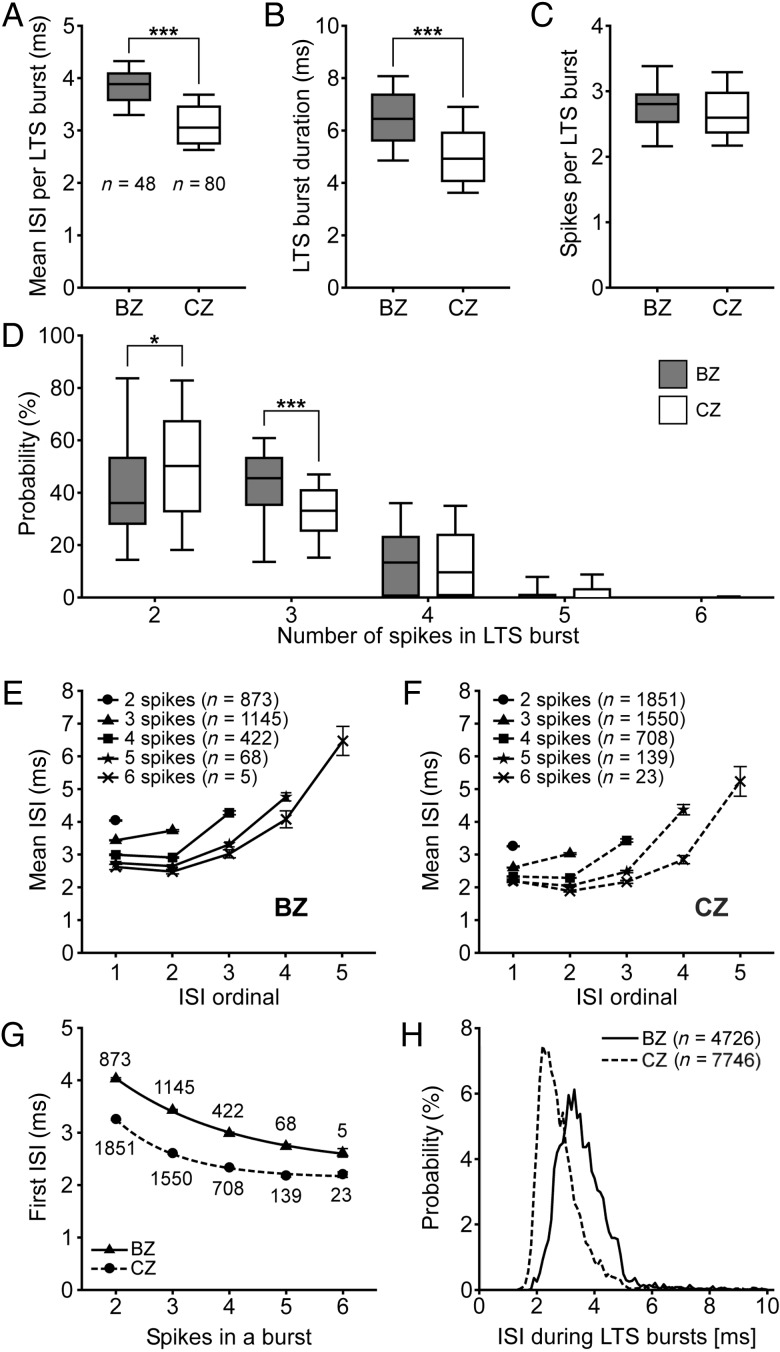
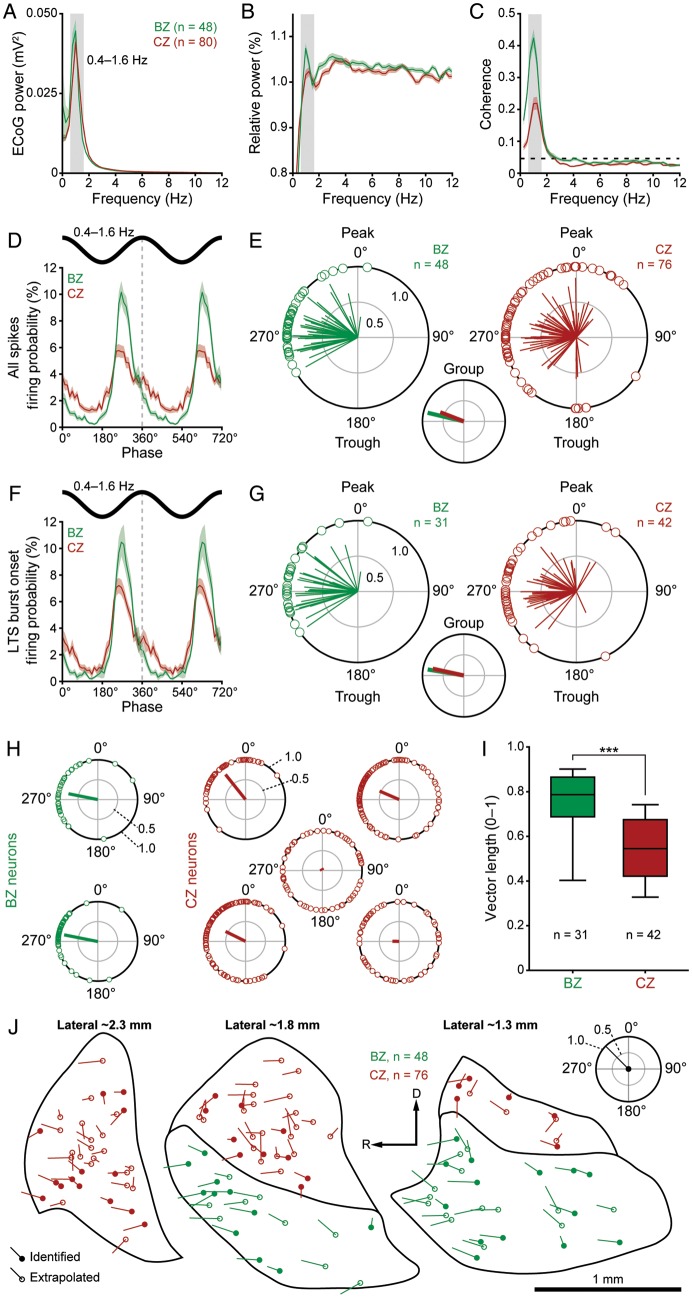
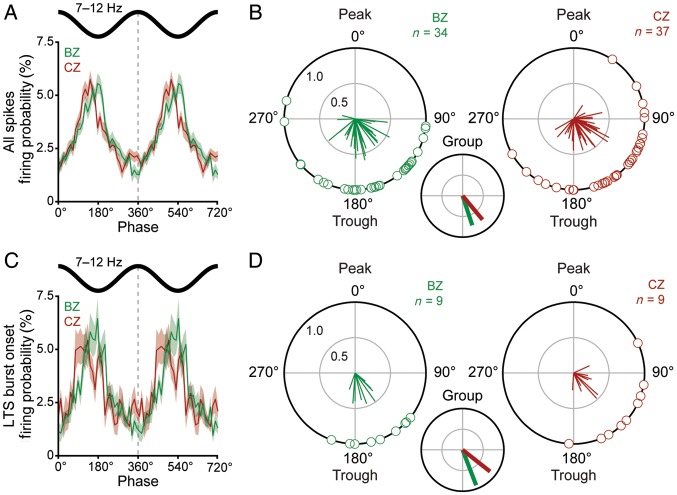
Neurons of the motor thalamus mediate basal ganglia and cerebellar influences on cortical activity. To elucidate the net result of γ-aminobutyric acid-releasing or glutamatergic bombardment of the motor thalamus by basal ganglia or cerebellar afferents, respectively, we recorded the spontaneous activities of thalamocortical neurons in distinct identified "input zones" in anesthetized rats during defined cortical activity states. Unexpectedly, the mean rates and brain state dependencies of the firing of neurons in basal ganglia-recipient zone (BZ) and cerebellar-recipient zone (CZ) were matched during slow-wave activity (SWA) and cortical activation. However, neurons were distinguished during SWA by their firing regularities, low-threshold spike bursts and, more strikingly, by the temporal coupling of their activities to ongoing cortical oscillations. The firing of neurons across the BZ was stronger and more precisely phase-locked to cortical slow (≈ 1 Hz) oscillations, although both neuron groups preferentially fired at the same phase. In contrast, neurons in BZ and CZ fired at different phases of cortical spindles (7-12 Hz), but with similar strengths of coupled firing. Thus, firing rates do not reflect the predicted inhibitory-excitatory imbalance across the motor thalamus, and input zone-specific temporal coding through oscillatory synchronization with the cortex could partly mediate the different roles of basal ganglia and cerebellum in behavior.

Keywords: basal ganglia; cerebellar nuclei; oscillation; spindle; thalamocortical.


Figures

Figure 1.
Figure 1.
Typical spike firing patterns and somatodendritic structure of identified neurons in the BZ and CZ of the motor thalamus. (A–C) Matched fluorescence images of Nissl labeling (A; inverted tone) and immunoreactivities for GAD67 (B) and VGluT2 (C) at the level of motor thalamus (VA, VM, and VL nuclei) in parasagittal view. “Standard” cytoarchitectonic borders of VM and the VA–VL complex (black lines in A) were extrapolated from an atlas (Paxinos and Watson 2007; ∼1.5 mm lateral from Bregma). These nuclei have similar cytoarchitecture (insets in A). GAD67 and VGluT2 immunoreactivities (in a section immediately adjacent to that in A) do not respect these cytoarchitectonic boundaries but do show complementary patterns in the motor thalamus; GAD67 is more intense ventrally (B), whereas VGluT2 is more evident dorsally (C). (B and C insets) High-magnification confocal images of immunoreactivity in VA, VM, and VL. Note: GAD67-immunoreactive punctate profiles are larger and denser in VA and VM compared with VL (B), whereas VGluT2-immunoreactive puncta are much larger and denser in VL compared with VA and VM (C). Thus, a BZ, corresponding to VA and VM nuclei, is delineated by GAD67 immunoreactivity, whereas a CZ, corresponding to VL, is delineated by VGluT2 immunoreactivity. BZ and CZ borders are indicated with dashed lines in B and C. (D and E) Spontaneous activity of a thalamic unit recorded in the BZ during SWA (D) and cortical activation (E), as defined by simultaneous ECoG recordings. Spindle oscillations (7–12 Hz; arrows) were often superimposed on cortical slow (∼1 Hz) oscillations (D). During SWA, LTS bursts (indicated with asterisks) were fired on most cycles of the slow oscillation. Such bursts were characterized by up to 6 spikes fired in rapid succession (instantaneous intraburst rate >150 spikes/s), with a progressive increase in ISIs and attenuation of spike amplitude during the burst (typical burst is highlighted by the dashed box and also shown at higher temporal resolution in the inset). (F) After recording, the neuron was juxtacellularly filled with Neurobiotin, fluorescently labeled and identified (white, arrowhead), and then localized to BZ, demarcated by intense GAD67 immunoreactivity (green) and sparse VGluT2 immunoreactivity (red) in the parasagittal section (lateral ∼1.8 mm). (G) Magnified view of the same identified neuron, which had “bushy” dendrites typical of thalamic projection neurons. (H and I) Spontaneous activity of a thalamic unit recorded in the CZ of another rat during SWA (H) and cortical activation (I). (J) The same neuron was juxtacellularly labeled and identified (white, arrowhead) and then localized to CZ, delineated by sparse GAD67 (green) and moderate VGluT2 (red) immunoreactivities in the parasagittal section (lateral ∼2.1 mm). (K) Magnified view of the same neuron. AD, anterodorsal nucleus; APT, anterior pretectal nucleus; AV, anteroventral nucleus; LD, laterodorsal nucleus; LP, lateroposterior nucleus; MD, mediodorsal nucleus; ml, medial lemniscus; PC, paracentral nucleus; PF, parafascicular nucleus; Po, posterior nuclear complex; Rt, thalamic reticular nucleus; VA, ventral anterior nucleus; VL, ventral lateral nucleus; VM, ventral medial nucleus; VPM, ventral posteromedial nucleus; ZI, zona incerta. R, rostral; D, dorsal. Scale bar in A also applies to low-magnification images in B and C. The 3 insets in each panel (A, B, or C) share the same scale.
Figure 2.
Figure 2.
Localization of all recorded thalamic neurons to BZ and CZ. (A–F) Parasagittal views of the locations of identified and extrapolated neurons recorded during either SWA (A–C) or cortical activation (D–F), as plotted at 3 different mediolateral planes; ∼2.3 mm (A and D), ∼1.8 mm (B and E), and ∼1.3 mm (C and F) lateral to Bregma. Borders between nuclei in AF were omitted when they could not be unambiguously delineated with labeling for Nissl substance, GAD67, or VGluT2. (G–I) Delineation of thalamic nuclei according to the closest 3 parasagittal planes available (lateral from Bregma: 2.4, 1.9, and 1.4 mm) in a widely used rat brain atlas (Paxinos and Watson 2007). Note that the boundaries of the BZ and CZ, (dashed lines) do not match nuclear borders delineated in the atlas on cytoarchitectonic grounds (solid black lines). AM, anteromedial nucleus; VPL, ventral posterolateral nucleus; abbreviations for other thalamic nuclei are defined in Figure 1. R, rostral; D, dorsal. Scale bar in A also applies to all other panels.
Figure 3.
Figure 3.
Quantitative comparisons of firing rates and patterns of thalamic neurons in BZ and CZ according to brain state. Mean firing rates (A and D), firing regularities, as measured by the coefficients of variation (CV) of ISIs (B and E), and mean percentage of all spikes occurring in LTS bursts (C and F) for all neurons recorded in the BZ and in the CZ. (A–C) Thalamic activity parameters during SWA. Firing regularity during SWA was separately defined for all spikes and for the onset times of LTS bursts (B). (D–F) Activity parameters during cortical activation. Although the firing rates and patterns of motor thalamic neurons were highly brain state dependent, BZ and CZ neurons did not differ in their mean firing rates or propensity to fire LTS bursts. Note that LTS bursts were rare during cortical activation. Box plots in this and subsequent figures denote the 10th and 90th percentiles (whiskers), interquartile range, and medians. n, the number of recorded neurons. *P = 0.049; **P = 0.005 (both Mann–Whitney U-tests).
Figure 4.
Figure 4.
Neurons in BZ and CZ have different LTS bursts. (A–C) Mean ISI per burst (A), mean burst duration (B), and mean number of spikes per LTS burst (C). Note that neurons in the BZ fire slower and longer LTS bursts than those in the CZ. n, the number of neurons analyzed. (D) CZ neurons tended to fire LTS bursts of 2 spikes more often than BZ neurons, whereas BZ neurons fired LTS bursts of 3 spikes more commonly than CZ neurons. (E and F) Plots of ISIs as a function of the number of spikes in the LTS burst. n, the number of bursts analyzed. Note the progressive increases in ISI durations as the bursts evolve. (G) For both groups of neurons, the duration of the first ISI in a given burst was highly predictive of the total number of spikes to be subsequently fired (R2 > 0.99 for both exponential decay curves). (H) Normalized ISI histograms (0.1 ms bins) for all spikes in all LTS bursts. Note the 2 unimodal distributions for BZ and CZ neurons only partially overlap and have distinct peak values. n, the number of ISIs analyzed. Data in E–G are mean ± SEM. *P < 0.05; ***P < 0.001 (Mann–Whitney U-tests).
Figure 5.
Figure 5.
Spike timings of neurons in the BZ and CZ in relation to cortical slow oscillations (0.4–1.6 Hz). (A) Mean power spectra of ECoGs simultaneously recorded with all neurons in the BZ (green) and all neurons in the CZ (red). (B) Mean power spectra of the spike discharges of BZ neurons (green) and CZ neurons (red) relative to power at 0.25–50 Hz. Note the peaks in power at frequencies similar to those of the cortical slow oscillations. (C) Mean coherence spectra between ECoGs and all BZ neurons (green) or all CZ neurons (red). The dashed horizontal line denotes the 95% confidence level. Note that BZ neurons are more coherent with cortex. (D) Linear phase histograms of all spikes for all BZ neurons (n = 48, green) and all CZ neurons (n = 80, red). For clarity, 2 cortical slow oscillation cycles are shown. (E) Circular plots of phase-locked firing of BZ neurons (green) and CZ neurons (red). Vectors of preferred firing of individual neurons are shown as lines radiating from the center. Greater vector lengths indicate lower variance in the distribution around the mean phase angle. Each circle on the plot perimeter represents the preferred phase (i.e. mean phase of all the spikes) of an individual neuron. A mean vector for the preferred phases of neurons in each group is shown as a thick line (BZ in green, CZ in red) in the smaller circular plot. Note the longer group vector of BZ neurons. (F and G) As in D and E, but for only the first spike in each LTS burst (n = 48 BZ neurons and 80 CZ neurons in F). (H) Circular plots of onsets of the LTS bursts of 2 typical BZ neurons (green) and 5 typical CZ neurons (red) recorded in a single animal. Vector of preferred firing of each neuron is shown (radiating line), and each circle on the perimeter of each plot represents the phase of the first spike in each LTS burst fired by that single neuron. Note the firing of the CZ neurons was often relatively weak and dispersed in terms of phase-locking. (I) Vector lengths for the first spike in LTS bursts of BZ neurons (green) and CZ neurons (red). (J) Vectors of preferred firing for all spikes of individual BZ neurons (green) and CZ neurons (red) plotted against their somata locations on 3 parasagittal planes of the rat motor thalamus. Identified and extrapolated neurons are shown as filled and open circles, respectively. Phases and lengths of the vectors are scaled according to the key plot (top right). Gray boxes in AC indicate the frequency range of slow oscillations analyzed. Data in AD and F are mean ± SEM. n, the number of neurons/ECoGs analyzed. ***P < 0.001, Mann–Whitney U-test. R, rostral; D, dorsal.
Figure 6.
Figure 6.
Spike timings of neurons in the BZ and CZ in relation to cortical spindle oscillations (7–12 Hz). (A) Linear phase histograms of all spikes for all neurons in the BZ (n = 48, green) and all neurons in the CZ (n = 80, red). For clarity, 2 spindle oscillation cycles are shown. (B) Circular plots of phase-locked firing of BZ neurons (green) and CZ neurons (red). Vectors of preferred firing of individual neurons are shown as lines radiating from the center. Greater vector lengths indicate lower variance in the distribution around the mean phase angle. Each circle on the plot perimeter represents the preferred phase (i.e. mean phase of all the spikes) of an individual neuron. A mean vector for the preferred phases of neurons in each group is shown as a thick line (BZ in green, CZ in red) in the smaller circular plot. Note the group vectors of BZ and CZ neurons are of similar length but different angles. (C and D) As in A and B, but for only the first spike in each LTS burst (n = 10 BZ neurons and 10 CZ neurons in C). Note the group vectors of BZ and CZ neurons are of similar lengths but different angles. Only neurons that fired ≥40 spikes (B) or LTS bursts (D) and were significantly phase-locked, were included in B and D. Data in A and C are mean ± SEM. n, the number of neurons analyzed.
Figure 7.
Figure 7.
Quantitative comparisons of the activities of VA and VM neurons. (A–D) Parasagittal views of the rat motor thalamus at 2 different mediolateral planes, ∼1.8 mm (A and C) and ∼1.3 mm (B and D) lateral to Bregma, showing the locations of all VA and VM neurons recorded during either SWA (A and B) or cortical activation (C and D). Neurons located near the “virtual border” between VA and VM were not analyzed (see Results). (E–G) Mean firing rates (E), firing regularities separately defined for all spikes and for the onset times of LTS bursts (F), and mean percentage of all spikes occurring in LTS bursts (G) during SWA. Note similarities between VA and VM neurons. (H–J) Mean ISI per LTS burst (H), mean burst duration (I), and mean number of spikes per burst (J). Note that VA and VM neurons fire similar LTS bursts. (K) The duration, and highly predictive nature, of the first ISI in a given LTS burst were similar for VA and VM neurons (R2 > 0.99 for both exponential decay curves). (L) Normalized ISI histograms (0.1 ms bins) for all spikes in all LTS bursts. Note the unimodal distributions for VA and VM neurons almost entirely overlapped. (M–O) Mean firing rates (M), firing regularities (N), and mean percentage of all spikes in LTS bursts (O) during cortical activation. Note similarities between VA and VM neurons. Scale bar in A also applies to B–D. Data in K are mean ± SEM. n, the number of recorded neurons (E–J and M–O), the number of LTS bursts (K), or the number of ISIs (L). Abbreviations are listed in Figures 1 and 2.

References

    1. Anderson ME, Turner RS. Activity of neurons in cerebellar-receiving and pallidal-receiving areas of the thalamus of the behaving monkey. J Neurophysiol. 1991;66:879–893. - PubMed
    1. Arai R, Jacobowitz DM, Deura S. Distribution of calretinin, calbindin-D28k, and parvalbumin in the rat thalamus. Brain Res Bull. 1994;33:595–614. - PubMed
    1. Arbuthnott GW, MacLeod NK, Maxwell DJ, Wright AK. Distribution and synaptic contacts of the cortical terminals arising from neurons in the rat ventromedial thalamic nucleus. Neuroscience. 1990;38:47–60. - PubMed
    1. Aumann TD, Horne MK. A comparison of the ultrastructure of synapses in the cerebello-rubral and cerebello-thalamic pathways in the rat. Neurosci Lett. 1996;211:175–178. - PubMed
    1. Aumann TD, Rawson JA, Finkelstein DI, Horne MK. Projections from the lateral and interposed cerebellar nuclei to the thalamus of the rat: a light and electron microscopic study using single and double anterograde labelling. J Comp Neurol. 1994;349:165–181. - PubMed

Publication types