. 2012 Dec 7;287(50):41757-73.
doi: 10.1074/jbc.M112.383836. Epub 2012 Oct 5.

LETM proteins play a role in the accumulation of mitochondrially encoded proteins in Arabidopsis thaliana and AtLETM2 displays parent of origin effects

Affiliations

LETM proteins play a role in the accumulation of mitochondrially encoded proteins in Arabidopsis thaliana and AtLETM2 displays parent of origin effects

Botao Zhang et al. J Biol Chem. .

Abstract

The Arabidopsis thaliana genome contains two genes with homology to the mitochondrial protein LETM1 (leucine zipper-EF-hand-containing transmembrane protein). Inactivation of both genes, Atletm1 and Atletm2, together is lethal. Plants that are hemizygous for AtLETM2 and homozygous for Atletm1 (letm1(-/-) LETM2(+/-)) displayed a mild retarded growth phenotype during early seedling growth. It was shown that accumulation of mitochondrial proteins was reduced in hemizygous (letm1(-/-) LETM2(+/-)) plants. Examination of respiratory chain proteins by Western blotting, blue native PAGE, and enzymatic activity assays revealed that the steady state level of ATP synthase was reduced in abundance, whereas the steady state levels of other respiratory chain proteins remained unchanged. The absence of a functional maternal AtLETM2 allele in an Atletm1 mutant background resulted in early seed abortion. Reciprocal crosses revealed that maternally, but not paternally, derived AtLETM2 was absolutely required for seed development. This requirement for a functional maternal allele of AtLETM2 was confirmed using direct sequencing of reciprocal crosses of Col-0 and Ler accessions. Furthermore, AtLETM2 promoter β-glucuronidase constructs displayed exclusive maternal expression patterns.


Figures
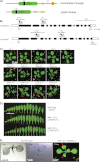
FIGURE 1.
FIGURE 1.
Identification of AtLETM1 and AtLETM2 mutants. A, diagram of the domain structure of LETM1-like proteins. TM, transmembrane region; cc, coiled-coil; LZ, leucine zipper; EF, EF-hand domain. B, diagram of insertion positions of T-DNAs in AtLETM1 and AtLETM2. Black boxes, open boxes, and black lines indicate exons, untranslated regions, and introns, respectively. Insertion sites were verified by sequencing of PCR products. C, 18-day-old wild type (Col-0) and AtLETM1 and AtLETM2 single and double mutants grown under long day regime (16-h photoperiod). The arrows indicate the leaves harvested for genotyping. D, arrangement of cotyledons and leaves 1–12 of wild-type and hemizygous letm1-1(−/−) LETM2-1(+/−) plants. The arrows indicate deformations at the leaf edge of young leaves. E, comparison of 12-day-old mutant letm1-1(−/−) LETM2-1(+/−) plant with 6–8-day-old AtLETM1 promoter-GUS reporter plants. The arrows indicate malformed leaf edges, which correspond with GUS the expression pattern.
FIGURE 2.
FIGURE 2.
In vivo and in vitro subcellular localization assay of AtLETM1 and AtLETM2. A, the full length (FL) and first 100 N-terminal amino acids (aa) were fused to the N terminus of GFP to assess targeting of GFP. AOX-RFP was used as a mitochondrial marker. Scale bars, 20 μm. B, in vitro import of radiolabeled AtLETM1 and AtLETM2 into isolated mitochondria. The radiolabeled precursor proteins were incubated with mitochondria under conditions that support protein uptake into mitochondria. The uptake of the AOX from Arabidopsis and PiC from maize was used as a control for mitochondrial import. Mit, mitochondria; Mit-OM, mitochondria with the outer membrane ruptured; PK, proteinase K; Val, valinomycin; P, precursor protein band; M, inner membrane protected protein band; I, intermediate protein; M′, inner membrane protected mature band protein when the outer membrane was ruptured prior to protease treatment. C, Western blotting of isolated mitochondria of wild-type (Col-0) and mitochondrial soluble and membrane fractions extracted by sodium carbonate. Two antibodies raised against AtLETM1 (AtLETM1 AB1 and AtLETM1 AB2) and antibodies against TIM17-2 and pyruvate dehydrogenase E1α were used as controls for membrane and soluble proteins, respectively. The apparent molecular masses are indicated in kDa as calculated using an LMW calibration kit (GE Healthcare).
FIGURE 3.
FIGURE 3.
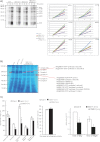
Analysis of mitochondrial protein abundance. A, Western blot analysis of mitochondria isolated from 10-day-old plants of wild-type (Col-0), letm1(−/−) LETM2(+/+), LETM1(+/+) letm2(−/−), and letm1(−/−) LETM2(+/−) with antibodies raised against LETM1. Equal amounts of mitochondrial protein were loaded in each lane. Dilutions of mitochondrial proteins from 20 to 5 μg were separated by SDS-PAGE, blotted to supported nitrocellulose, and probed with the LETM1 antibody. Detection of cross-reacting products was carried out using chemiluminescence, and the signal was captured using ImageQuant RT ECL (GE Healthcare) with the signal intensity (pixel intensity) adjusted relative to wild type (Col-0) and set to 100. Numbers in gray represent intensity with S.E. from n = 3. B, mitochondria from 10-day-old water culture-grown plants were isolated and separated by SDS-PAGE and probed with antibodies to a variety of mitochondrial proteins. The change in abundance of protein in the letm1-1(−/−) LETM2-1(+/−) line compared with wild type (Col-0) is indicated beside each blot with S.E. values. UCP, uncoupling protein; RISP, Rieske FeS protein.
FIGURE 4.
FIGURE 4.
Analysis of mitochondrial proteins in letm1(−/−) LETM2(+/−) plants. A, in organello protein synthesis in mitochondria isolated from 10-day-old plants of wild-type (Col-0), letm1(−/−) LETM2(+/+), LETM1(+/+) letm2(−/−), and letm1(−/−) LETM2(+/−) plants analyzed by SDS-PAGE. Shown is incorporation of [35S]methionine into proteins from mitochondria isolated from wild-type (Col-0), letm1(−/−) LETM2(+/+), LETM1(+/+) letm2(−/−), and letm1(−/−) LETM2(+/−) plants. The arrows indicate bands that can be identified from their apparent molecular mass based on previous studies (10, 20), and incorporation of [35S]methionine into these bands was determined over time. B, BN-PAGE analysis of mitochondrial proteins isolated from 10-day-old plants of wild type (Col-0), letm1(−/−) LETM2(+/+), LETM1(+/+) letm2(−/−), and letm1(−/−) LETM2(+/−). The red arrows indicate the bands that were different between wild type (Col-0), letm1(−/−) LETM2(+/+), LETM1(+/+) letm2(−/−), and letm1(−/−) LETM2(+/−), and these bands were subject to mass spectrometry for identification. C, oxygen consumption of mitochondria isolated from wild type (Col-0) and hemizygous letm1-1(−/−) LETM2-1(+/−) plants in the presence of different substrates. Succinate dehydrogenase activity in wild-type (Col-0) and hemizygous letm1-1(−/−) LETM2-1(+/−) plants. Shown is measurement of total ATP content of leaves from wild-type (Col-0) and hemizygous letm1-1(−/−) LETM2-1(+/−) plants. The amount of ATP is normalized to the highest amount measured in wild type (Col-0). Error bars, S.E.
FIGURE 5.
FIGURE 5.
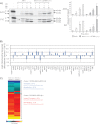
Analysis of the import of proteins and steady state mitochondrial transcript abundance levels in letm1-1(−/−) LETM2-1(+/−) Arabidopsis plants. A, import of PiC and AOX into isolated mitochondria from 10-day-old wild-type (Col-0) and letm1-1(−/−) LETM2-1(+/−) mutant in liquid culture. Radiolabeled translation products were incubated with isolated mitochondria, and samples were taken at different time intervals. Protein extracts were then separated by SDS-PAGE. The precursor (P), mature (M), and intermediate (I) bands and the addition of externally added protease (PK) are indicated. The rate of import was quantified from three individual mitochondrial isolations, and the average and S.E. values (error bars) (n = 3) are shown. B, quantitative RT-PCR was carried out to determine the abundance of mitochondrial transcripts in letm1-1(−/−) LETM2-1(+/−) mutant seedlings compared with wild-type (Col-0) seedlings. Transcript abundance is displayed as log2 of the ratio of values determined in mutant versus wild-type (Col-0) samples for each transcript. Three biological replicates were performed, with three technical replicates for each sample performed and averaged; S.E. values are indicated. Nuclear 18S (used as a normalization control) along with ACT2 and UBC transcripts were included as controls. C, summary of differentially expressed genes with -fold changes greater than 1.5-fold, after false discovery rate correction, either up-regulated (shown in red shading) or down-regulated (shown in blue shading) for various comparisons between different genotypes. A color scale is shown. Brighter red and blue coloring and black boxes indicate that a greater number of transcripts are changing in letm1(−/−) LETM2(+/−) versus wild-type (Col-0) plants.
FIGURE 6.
FIGURE 6.
Seed sets of crossing of AtLETM1 and AtLETM2 single and double mutants. A, siliques from the self-crossing of double mutant letm1-1(−/−) LETM2-1(+/−) and the crossing of double mutant letm1-1(−/−) LETM2-1(+/−) with single mutant letm1-1(−/−) LETM2-1(+/+) and with wild-type (Col-0). +, aborted embryos. Values indicate the average number of viable and aborted progeny per silique ± S.D. (n = 10). Scale bar, 0.5 cm. The crosses of both alleles are shown, with the top five panels representing one allele of AtLETM1 and AtLETM2 and the bottom five panels representing similar crosses with the second allele for both AtLETM1 and AtLETM2. +, statistically similar to theoretical 1:1 ratio (p > 0.50); #, statistically similar to theoretical 1:0 ratio (p > 0.90). B, microscopic analysis of different stages of development for embryos in letm1(−/−) LETM2(+/−) mutant plants. Gametophyte, early embryo, and seeds 3 and 7 days after pollination (DAP) are shown. Some embryos of letm1-1(−/−) LETM2-1(+/−) plants are aborted in the 2–4-cell stage (7), whereas other embryos are aborted at the globular stage (8). cc, central cell; ec, egg cell; s, synergid; es, endosperm; z, zygote. C, number of pollen grains and percentage of defective pollen as determined by Alexander staining. Arrow, defective pollen grain. *, statistically significant difference compared with wild-type (Col-0) (p < 0.01). Scale bars, 20 μm. Error bars, S.E.
FIGURE 7.
FIGURE 7.
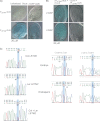
LETM2 expression shows parent of origin effect. A, expression pattern of AtLETM1::GUS and AtLETM2::GUS promoter reporter plants in unfertilized ovules and 2 days after self-pollination (DAP). B, reciprocal crosses between LETM2::GUS and wild-type (Col-0) plants 2 and 4 days postpollination, respectively. No GUS activity is detected when of paternal origin. C, Sanger sequencing chromatograms of partial LETM2 cDNA showing a polymorphism between Col-0 and Ler ecotypes. Col-0 + Ler, artificial 1:1 mix of Col-0 and Ler cDNA as control for equal sequencing efficiency of the polymorphism. Reciprocal crosses of Col-0 with Ler indicate that the maternal cDNA is predominant. Scale bars, 50 μm.

References

    1. Dyall S. D., Brown M. T., Johnson P. J. (2004) Ancient invasions. From endosymbionts to organelles. Science 304, 253–257 - PubMed
    1. Burger G., Gray M. W., Lang B. F. (2003) Mitochondrial genomes. Anything goes. Trends Genet. 19, 709–716 - PubMed
    1. Gray M. W., Burger G., Lang B. F. (1999) Mitochondrial evolution. Science 283, 1476–1481 - PubMed
    1. Gray M. W., Burger G., Lang B. F. (2001) The origin and early evolution of mitochondria. Genome Biol. 2, REVIEWS1018 - PMC - PubMed
    1. Gray M. W., Lang B. F., Burger G. (2004) Mitochondria of protists. Annu. Rev. Genet. 38, 477–524 - PubMed

Publication types

MeSH terms

Substances

LinkOut - more resources