. 2012 Oct 23;109(43):17513-8.
doi: 10.1073/pnas.1202997109. Epub 2012 Oct 4.

Phylogenetic modeling of lateral gene transfer reconstructs the pattern and relative timing of speciations

Affiliations

Phylogenetic modeling of lateral gene transfer reconstructs the pattern and relative timing of speciations

Gergely J Szöllosi et al. Proc Natl Acad Sci U S A. .

Abstract

The timing of the evolution of microbial life has largely remained elusive due to the scarcity of prokaryotic fossil record and the confounding effects of the exchange of genes among possibly distant species. The history of gene transfer events, however, is not a series of individual oddities; it records which lineages were concurrent and thus provides information on the timing of species diversification. Here, we use a probabilistic model of genome evolution that accounts for differences between gene phylogenies and the species tree as series of duplication, transfer, and loss events to reconstruct chronologically ordered species phylogenies. Using simulations we show that we can robustly recover accurate chronologically ordered species phylogenies in the presence of gene tree reconstruction errors and realistic rates of duplication, transfer, and loss. Using genomic data we demonstrate that we can infer rooted species phylogenies using homologous gene families from complete genomes of 10 bacterial and archaeal groups. Focusing on cyanobacteria, distinguished among prokaryotes by a relative abundance of fossils, we infer the maximum likelihood chronologically ordered species phylogeny based on 36 genomes with 8,332 homologous gene families. We find the order of speciation events to be in full agreement with the fossil record and the inferred phylogeny of cyanobacteria to be consistent with the phylogeny recovered from established phylogenomics methods. Our results demonstrate that lateral gene transfers, detected by probabilistic models of genome evolution, can be used as a source of information on the timing of evolution, providing a valuable complement to the limited prokaryotic fossil record.


Conflict of interest statement

The authors declare no conflict of interest.

Figures
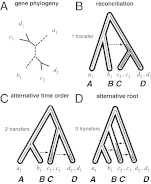
Fig. 1.
Fig. 1.
A gene tree–species tree reconciliation invoking gene transfer and loss. (A) A gene tree topology. (B) A possible reconciliation of the gene tree in A with the species tree invoking one event of transfer. Note that the transfer from the branch leading to B to above the ancestor of C and D implies that the ancestor of A and B is older than the ancestor of C and D. (C and D) Alternative time orders (C) or rootings (D) of the species tree violate this condition and only allow reconciliations with a larger number of events.
Fig. 2.
Fig. 2.
Inference robustness on simulations. We performed simulations with realistic parameters including branch-wise rate variations, origination outside of the root, and independent reconstruction errors. A compares the reconstructed number of branch-wise events for a fixed time order for gene trees with no reconstruction errors. B shows the accuracy of recovering a rooted species phylogeny measured as the average Robinson-Foulds distance for different RNNI [number of random NNIs (17)]. Averages over at least 30 simulations are shown, except for RNNI = 32 with eight simulations. C shows the accuracy of recovering the time order for a fixed topology and rooting. The color scale gives the fraction of times a rank was inferred for each node in the known tree. Squares along the diagonal indicate the number of times the correct time order was recovered. For each value of RNNI the average over 100 simulations is shown. The number of species in S was reduced to 14 for computational tractability (making the RNNI perturbation more severe).
Fig. 3.
Fig. 3.
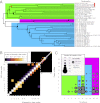
Chronologically ordered phylogeny reconstructed from 36 cyanobacterial genomes. (A) The maximum likelihood time orders are indicated as node labels. Squares correspond to major diversification events discussed in the text. The tree shown was calculated using a uniform model; using a branch-specific DTL rate model gives an identical topology and very similar time orders (SI Appendix, Fig. S10). Root positions discussed in the text and Table 2 are indicated by the coloring: green, node 3; blue, node 8; violet, node 16 rooting the tree. The green rooting is shown. Branch lengths are derived from the time order assuming time slices of equal width. (B) The P value of alternative time orders were calculated using 328 candidate time orders corresponding to all deep time order moves around the ML solution (combined AU test with all families and 50% most congruent). (C) The number of transfers supporting different time orders in the ML solution are shown for the nodes discussed in the text. The area of each bubble is proportional to the number of transfers from branches descending from a speciation to above a speciation occurring later in time. In general a transfer belongs to multiple fields; for example, some of the transfers from within 4 to above 16 may be from within 5 to above 16.
Fig. 4.
Fig. 4.
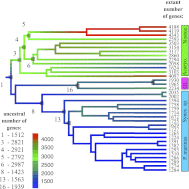
Number of genes in ancestral genomes. Color scale shows the number of genes in ancestral genomes on the tree presented in Fig. 3A. Estimates were obtained by averaging maximum likelihood reconciliations over gene tree roots and origination positions and compensating for extinct gene lineages. Squares correspond to major diversification events discussed in the text. Color bars show correspondence with species names in Fig. 3A.

References

    1. Benton MJ, Ayala FJ. Dating the tree of life. Science. 2003;300:1698–1700. - PubMed
    1. Peterson KJ, et al. Estimating metazoan divergence times with a molecular clock. Proc Natl Acad Sci USA. 2004;101:6536–6541. - PMC - PubMed
    1. Douzery EJP, Snell EA, Bapteste E, Delsuc F, Philippe H. The timing of eukaryotic evolution: Does a relaxed molecular clock reconcile proteins and fossils? Proc Natl Acad Sci USA. 2004;101:15386–15391. - PMC - PubMed
    1. Drummond AJ, Ho SYW, Phillips MJ, Rambaut A. Relaxed phylogenetics and dating with confidence. PLoS Biol. 2006;4:e88. - PMC - PubMed
    1. Knoll AH. Life on a Young Planet: The First Three Billion Years of Evolution on Earth. Princeton, NJ: Princeton Univ Press; 2003.

Publication types

LinkOut - more resources