

Clinical evaluation of analytical variations in serum creatinine measurements: why laboratories should abandon Jaffe techniques
- PMID: 23043743
- PMCID: PMC3504563
- DOI: 10.1186/1471-2369-13-133
Clinical evaluation of analytical variations in serum creatinine measurements: why laboratories should abandon Jaffe techniques
Abstract
Background: Non-equivalence in serum creatinine (SCr) measurements across Dutch laboratories and the consequences hereof on chronic kidney disease (CKD) staging were examined.
Methods: National data from the Dutch annual external quality organization of 2009 were used. 144 participating laboratories examined 11 pairs of commutable, value-assigned SCr specimens in the range 52-262 μmol/L, using Jaffe or enzymatic techniques. Regression equations were created for each participating laboratory (by regressing values as measured by participating laboratories on the target values of the samples sent by the external quality organization); area under the curves were examined and used to rank laboratories. The 10th and 90th percentile regression equation were selected for each technique separately. To evaluate the impact of the variability in SCr measurements and its eventual clinical consequences in a real patient population, we used a cohort of 82424 patients aged 19-106 years. The SCr measurements of these 82424 patients were introduced in the 10th and 90th percentile regression equations. The newly calculated SCr values were used to calculate an estimated glomerular filtration rate (eGFR) using the 4-variable Isotope Dilution Mass Spectrometry traceable Modification of Diet in Renal Disease formula. Differences in CKD staging were examined, comparing the stratification outcomes for Jaffe and enzymatic SCr techniques.
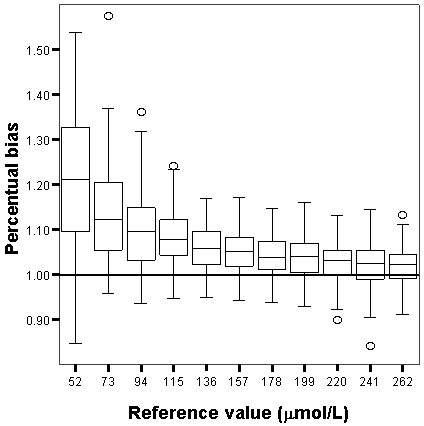
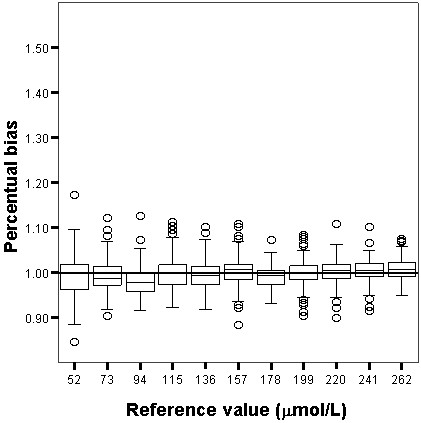
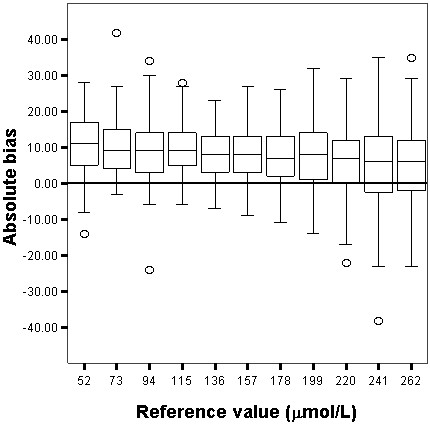
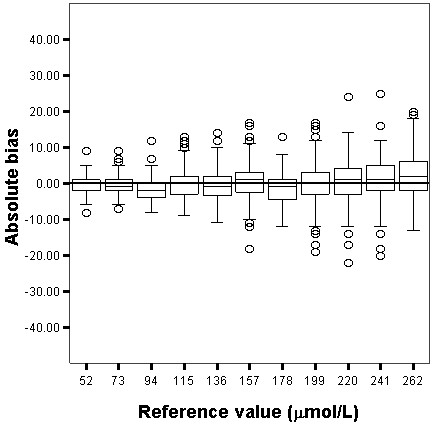
Results: Jaffe techniques overestimated SCr: 21%, 12%, 10% for SCr target values 52, 73 and 94 μmol/L, respectively. For enzymatic assay these values were 0%, -1%, -2%, respectively. eGFR using the MDRD formula and SCr measured by Jaffe techniques, staged patients in a lower CKD category. Downgrading to a lower CKD stage occurred in 1-42%, 2-37% and 12-78.9% of patients for the 10th and 90th percentile laboratories respectively in CKD categories 45-60, 60-90 and >90 ml/min/1.73 m2. Using enzymatic techniques, downgrading occurred only in 2-4% of patients.
Conclusions: Enzymatic techniques lead to less variability in SCr measurements than Jaffe techniques, and therefore result in more accurate staging of CKD. Therefore the specific enzymatic techniques are preferably used in clinical practice in order to generate more reliable GFR estimates.
Figures
References
-
- Myers GL, Miller WG, Coresh J, Fleming J, Greenberg N, Greene T, Hostetter T, Levey AS, Panteghini M, Welch M, Eckfeldt JH. National Kidney Disease Education Program Laboratory Working Group. Recommendations for improving serum creatinine measurement: a report from the Laboratory Working group of the National Kidney Disease Education Program. Clin Chem. 2006;52:5–18. doi: 10.1373/clinchem.2005.0525144. - DOI - PubMed
-
- Panteghini M, Myers G, Miller WG, Greenberg N. The importance of metrological traceability on the validity of creatinine measurement as an index of renal function. Clin Chem Lab Med. 2006;44:1287–1292. - PubMed
Publication types
MeSH terms
Substances
LinkOut - more resources
Full Text Sources
Medical
Research Materials
Miscellaneous
