. 2012 Dec;81(12):1022-30.
doi: 10.1002/cyto.a.22209. Epub 2012 Oct 8.

RchyOptimyx: cellular hierarchy optimization for flow cytometry

Affiliations

RchyOptimyx: cellular hierarchy optimization for flow cytometry

Nima Aghaeepour et al. Cytometry A. 2012 Dec.

Abstract

Analysis of high-dimensional flow cytometry datasets can reveal novel cell populations with poorly understood biology. Following discovery, characterization of these populations in terms of the critical markers involved is an important step, as this can help to both better understand the biology of these populations and aid in designing simpler marker panels to identify them on simpler instruments and with fewer reagents (i.e., in resource poor or highly regulated clinical settings). However, current tools to design panels based on the biological characteristics of the target cell populations work exclusively based on technical parameters (e.g., instrument configurations, spectral overlap, and reagent availability). To address this shortcoming, we developed RchyOptimyx (cellular hieraRCHY OPTIMization), a computational tool that constructs cellular hierarchies by combining automated gating with dynamic programming and graph theory to provide the best gating strategies to identify a target population to a desired level of purity or correlation with a clinical outcome, using the simplest possible marker panels. RchyOptimyx can assess and graphically present the trade-offs between marker choice and population specificity in high-dimensional flow or mass cytometry datasets. We present three proof-of-concept use cases for RchyOptimyx that involve 1) designing a panel of surface markers for identification of rare populations that are primarily characterized using their intracellular signature; 2) simplifying the gating strategy for identification of a target cell population; 3) identification of a non-redundant marker set to identify a target cell population.


Figures

Figure 1
Figure 1
Dynamic programming algorithm for two cell populations defined by three markers. The best path for each of the cell population is shown in red and blue respectively. As an example, the red path ends at CD4+CCR5+CD127+. Three markers are available to be added. First, CD4 is added (changes from does not matter to positive). Then two options will be available for the next step (CD127 and CCR5). After selection of CCR5, only one option will be left for the final step (CD127). Therefore for three markers, 3(31)2=6 comparisons were required. Left: A hierarchy for the two paths. The label of an edge is the name of the single marker phenotype that is the difference between its head set (s) and its tail set (t). Right: the dynamic programming space for the three markers. Black spheres mark the nodes in the dynamic programing space used by the two paths. The colors of the nodes on the left match that of the square tori on the right and correspond to the relative score of each cell population. [Color figure can be viewed in the online issue which is available at wileyonlinelibrary.com]
Figure 2
Figure 2
Three optimized hierarchies for identification of cell populations with maximum response to IL7, BCR, and LPS measured by pSTAT5, pBLNK, and p-p38, respectively. The color of the nodes and the thickness of the edges shows the proportion and change in proportion of cells expressing the intracellular marker of interest, respectively. [Color figure can be viewed in the online issue which is available at wileyonlinelibrary.com]
Figure 3
Figure 3
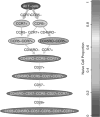
An optimized cellular hierarchy for identifying naive T-cells. The color of the nodes and the thickness of the edges shows the purity and change in purity of the original naive phenotype within the given cell population, respectively. [Color figure can be viewed in the online issue which is available at wileyonlinelibrary.com]
Figure 4
Figure 4
An optimized hierarchy for all three populations correlated with protection against HIV. The color of the nodes shows the significance of the correlation with the clinical outcome (P-value of the logrank test for the Cox proportional hazards model) and the width of each edge (arrow) shows the amount of change in this variable between the respective nodes. The positive and negative correlation of each immunophenotype with outcome can be seen from the arrow type leading to the node; however as all correlations are negative in this hierarchy, only one arrow type is shown. [Color figure can be viewed in the online issue which is available at wileyonlinelibrary.com]

References

    1. Maecker HT, McCoy JP, Nussenblatt R. Standardizing immunophenotyping for the Human Immunology Project. Nat Rev Immunol. 2012;12:191–200. - PMC - PubMed
    1. Roederer M, Tárnok A. OMIPsOrchestrating multiplexity in polychromatic science. Cytometry Part A. 2010;77A:811–812. - PubMed
    1. Mahnke YD, Roederer M. OMIP-001: Quality and phenotype of Ag-responsive human T-cells. Cytometry Part A. 2010;77A:819–820. - PubMed
    1. Chattopadhyay P, Roederer M, Price D. OMIP-002: Phenotypic analysis of specific human CD8+ T-cells using peptide-MHC class I multimers for any of four epitopes. Cytometry Part A. 2010;77A:821–822. - PubMed
    1. Wei C, Jung J, Sanz I. OMIP-003: Phenotypic analysis of human memory B cells. Cytometry Part A. 2011;79A:894–896. - PMC - PubMed

Publication types

LinkOut - more resources