Comparative Study
. 2012 Oct;130(10):1291-300.
doi: 10.1001/archophthalmol.2012.2270.

Evaluation of normal human foveal development using optical coherence tomography and histologic examination

Affiliations
Comparative Study

Evaluation of normal human foveal development using optical coherence tomography and histologic examination

Adam M Dubis et al. Arch Ophthalmol. 2012 Oct.

Abstract

Objective: To assess outer retinal layer maturation during late gestation and early postnatal life using optical coherence tomography and histologic examination.

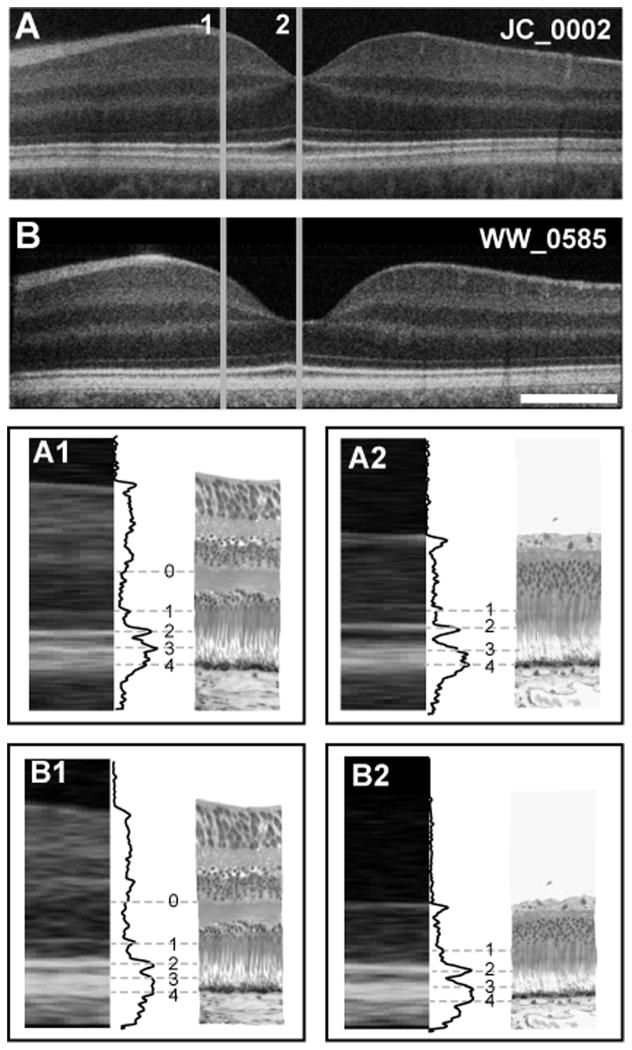
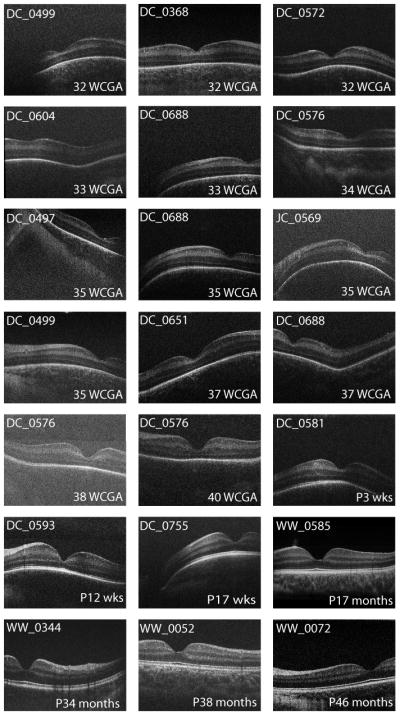
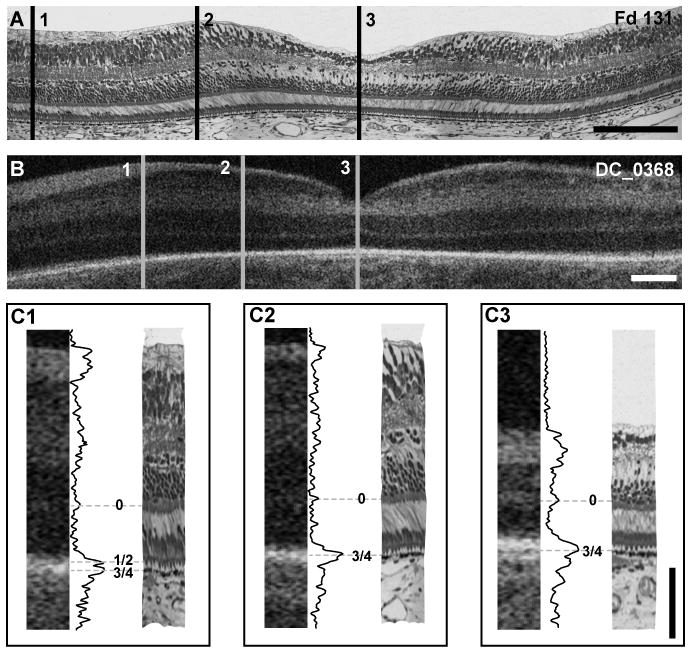
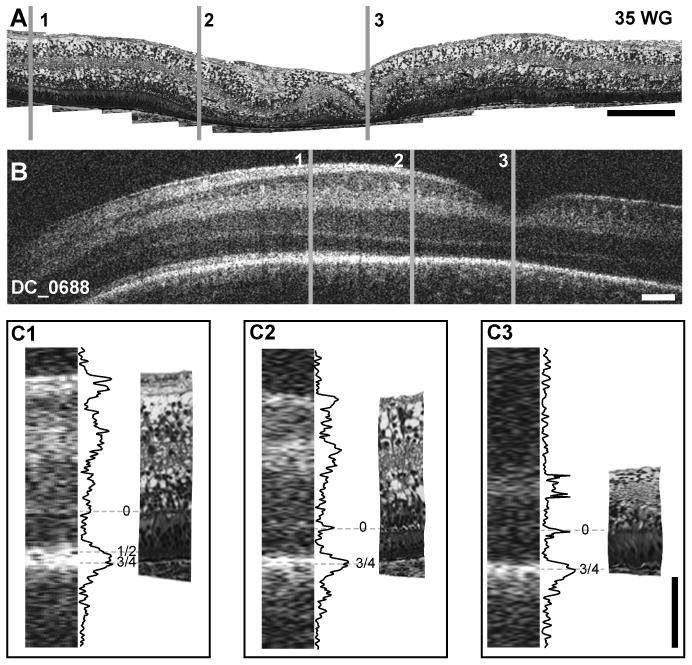
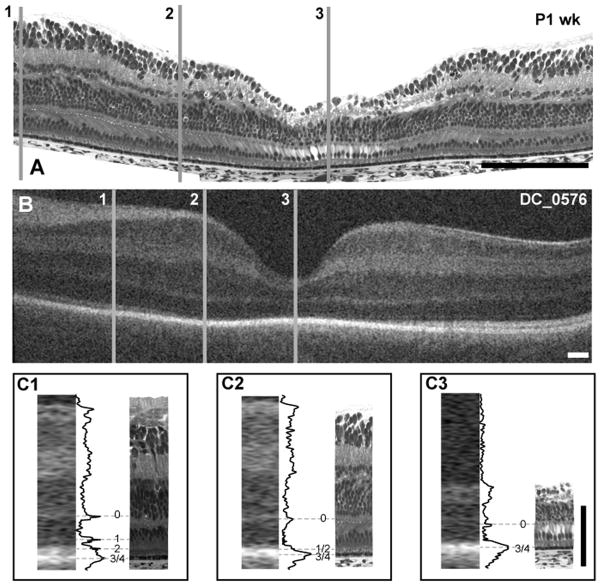
Methods: Thirty-nine participants 30 weeks' postmenstrual age or older were imaged using a handheld optical coherence tomography system, for a total of 102 imaging sessions. Foveal images from 16 participants (21 imaging sessions) were normal and evaluated for inner retinal excavation and the presence of outer retinal reflective bands. Reflectivity profiles of central, parafoveal, and parafoveal retina were extracted and were compared with age-matched histologic sections.

Results: The foveal pit morphologic structure in infants was generally distinguishable from that in adults. Reflectivity profiles showed a single hyperreflective band at the fovea in all the infants younger than 42 weeks' postmenstrual age. Multiple bands were distinguishable in the outer retina at the peri fovea by 32 weeks' postmenstrual age and at the fovea by 3 months' postterm. By 17 months' postnatal, the characteristic appearance of 4 hyperreflective bands was evident across the foveal region. These features are consistent with previous results from histologic examinations. A "temporal divot" was present in some infants, and the foveal pit morphologic structure and the extent of inner retinal excavation were variable.

Conclusions: Handheld optical coherence tomography is a viable technique for evaluating neonatal retinas. In premature infants who do not develop retinopathy of prematurity, the foveal region seems to follow a developmental time course similar to that associated with in utero maturation.

Clinical relevance: As pediatric optical coherence tomography becomes more common, a better understanding of normal foveal and macular development is needed. Longitudinal imaging offers the opportunity to track postnatal foveal development among preterm infants in whom poor visual outcomes are anticipated or to follow up treatment outcomes in this population.


Figures

Figure 1
Figure 1
Foveal layer assignment in the human retina. (A) Shown is an OCT image of a 28-year-old retina (JC_0002) and (B) a 17-month-old retina (WW_0585), compared to histology at parafoveal (1) and foveal (2) locations. A1 and B1 are the assignment of outer retinal layer bands 0–4, illustrated with grey lines connecting the OCT image, LRP and histological image for the parafoveal area. Band assignments in the foveal region are shown in A2 and B2. Scale bar is 500μm.
Figure 2
Figure 2
Spectrum of foveal morphology observed with OCT. Shown are foveal scans from all exams meeting the inclusion criteria. Images are single frames extracted from a macular volume. Considerable variability exists at the 32 to 33 week PMA stage. By 17 months of age, the retina appears adult like. Another interesting feature is that some subjects have a dip like structure located temporally to the macula. We have termed this structure the “temporal divot”.
Figure 3
Figure 3
Foveal development and layer assignment compared between a Fd 131 macaque (A) and 32 weeks PMA human infant (B, DC_0368). Lines 1 – 3 represent perifoveal, parafoveal and foveal locations, respectively. Insets C1–C3 at bottom are comparison of histology and OCT images, with layer assignment for perifoveal (C1), parafoveal (C2) and foveal (C3) locations. At the perifoveal location, bands 0, 1/2 and 3/4 are present, whereas only bands 0 and 3/4 are present at parafoveal and foveal locations. Scale bar in panels A & B is approximately 250 μm, horizontally; scale bar in panel C is 100 μm vertically.
Figure 4
Figure 4
Foveal development and layer assignment compared between 35 weeks PMA histological section from human donor (A) and 35 weeks PMA infant imaged with OCT (B- DC_0688). Lines 1 – 3 represent perifoveal, parafoveal and foveal locations, respectively. Insets C1–C3 at bottom are comparison of histology and OCT images, with layer assignment for perifoveal (C1), parafoveal (C2) and foveal (C3) locations. At the perifoveal location, bands 0, 1/2 and 3/4 are present, whereas only bands 0 and 3/4 are present at parafoveal and foveal locations. The 35 weeks PMA retina shows moderate edema in the central fovea, which causes buckling of the retina (between C2 and C3) and blister-like distortion of the innermost layer. Scale bar in panels A & B is approximately 250 μm, horizontally; scale bar in panel C is 100 μm vertically.
Figure 5
Figure 5
Foveal development and layer assignment in a histological sample from a 41 weeks PMA human donor (A) and 38 weeks PMA infant (B-DC_0576). Gray lines 1 – 3 are representing perifoveal, parafoveal and foveola respectively. Insets C1–C3 at bottom are comparison of histology and OCT images, with layer assignment for perifoveal (C1), parafoveal (C2) and fovea (C3). At the perifoveal location, bands 0, 1, 2 and 3/4 are present, whereas only bands 0, 1/2 and 3/4 are present at parafoveal and band 0 and 3/4 at the fovea. Scale bar in panels A & B is approximately 250 μm, horizontally; scale bar in panel C is 100 μm vertically.
Figure 6
Figure 6
Time course of photoreceptor maturation in fovea, parafoveal and perifoveal locations. Images are labeled with band assignments as seen in OCT. The 35 weeks PMA retina shows moderate edema in the central fovea, which causes buckling of the retina and blister-like distortion of the innermost layer, however these tissue artifacts do not interfere with layer identification. Arrows do not indicate layer thickness, simply the presence of a distinct band. Band 0 corresponds to the OPL, band 1 is the ELM, band 2 is the ISe, band 3 is the RPE/photoreceptor interdigitations and band 4 is the RPE. Images from the foveal (top row), parafoveal (middle row) and perifoveal (bottom row) region. Scale bar is 50 μm.

References

    1. Yuodelis C, Hendrickson A. A qualitative and quantitative analysis of the human fovea during development. Vision Research. 1986;26(6):847–855. - PubMed
    1. Hendrickson AE, Yuodelis C. The morphological development of the human fovea. Ophthalmology. 1984;91(6):603–612. - PubMed
    1. Diaz-Araya C, Provis JM. Evidence of photoreceptor migration during early foveal development: a quantitative analysis of human fetal retinae. Visual Neuroscience. 1992;8(6):505–514. - PubMed
    1. Mann I. The Development of the Human Retina. New York: Grune & Stratton; 1950.
    1. Yamada E. Some structural features of the fovea centralis in the human retina. Archives of Ophthalmology. 1969;82:151–159. - PubMed

Publication types