

High phosphate feeding promotes mineral and bone abnormalities in mice with chronic kidney disease
- PMID: 23045434
- PMCID: PMC3539425
- DOI: 10.1093/ndt/gfs333
High phosphate feeding promotes mineral and bone abnormalities in mice with chronic kidney disease
Abstract
Background: Chronic kidney disease-mineral bone disorder (CKD-MBD) is a systemic syndrome characterized by imbalances in mineral homeostasis, renal osteodystrophy (ROD) and ectopic calcification. The mechanisms underlying this syndrome in individuals with chronic kidney disease (CKD) are not yet clear.
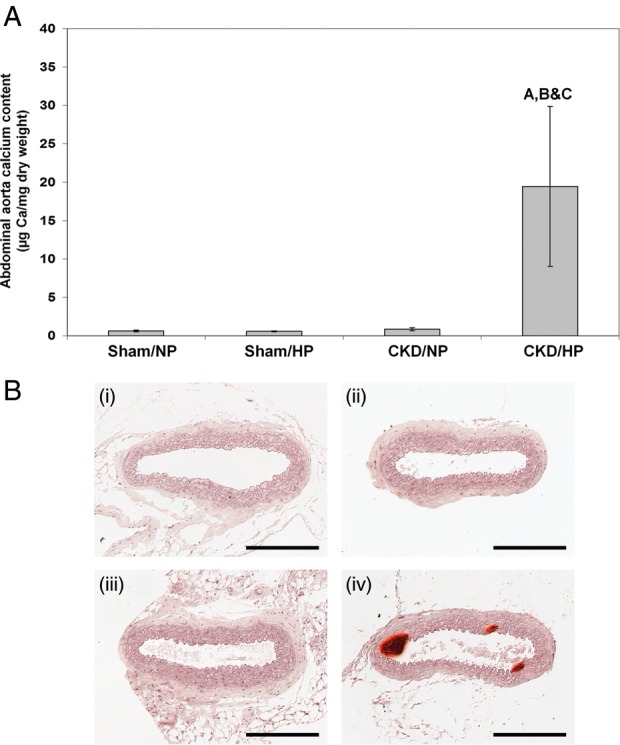
Methods: We examined the effect of normal phosphate (NP) or high phosphate (HP) feeding in the setting of CKD on bone pathology, serum biochemistry and vascular calcification in calcification-prone dilute brown non-agouti (DBA/2) mice.
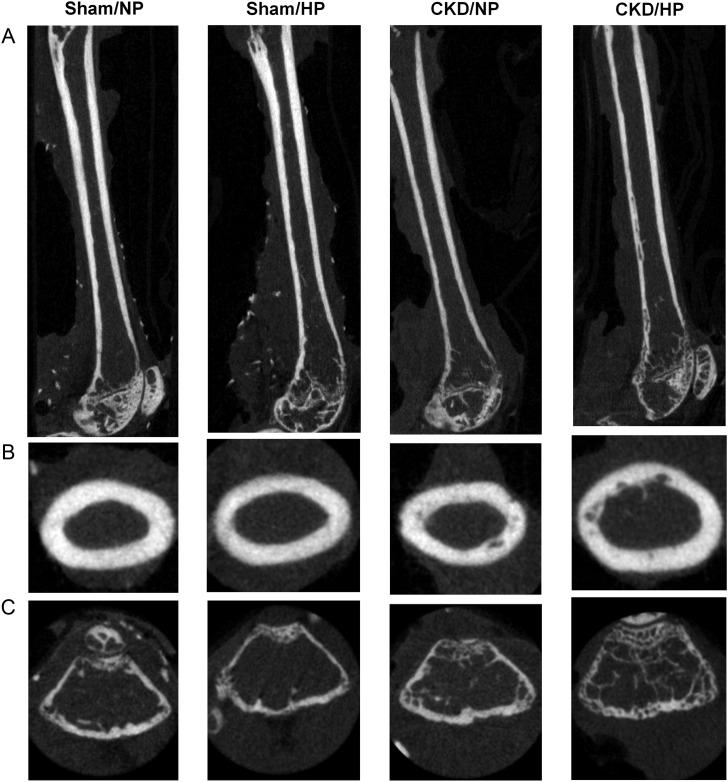
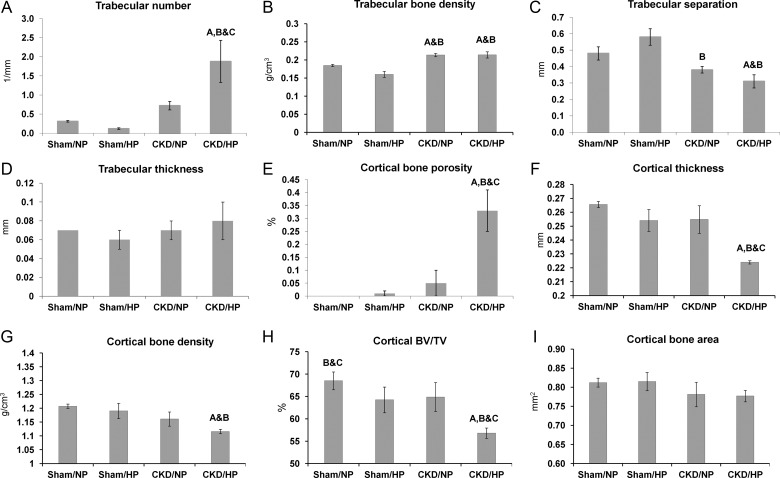
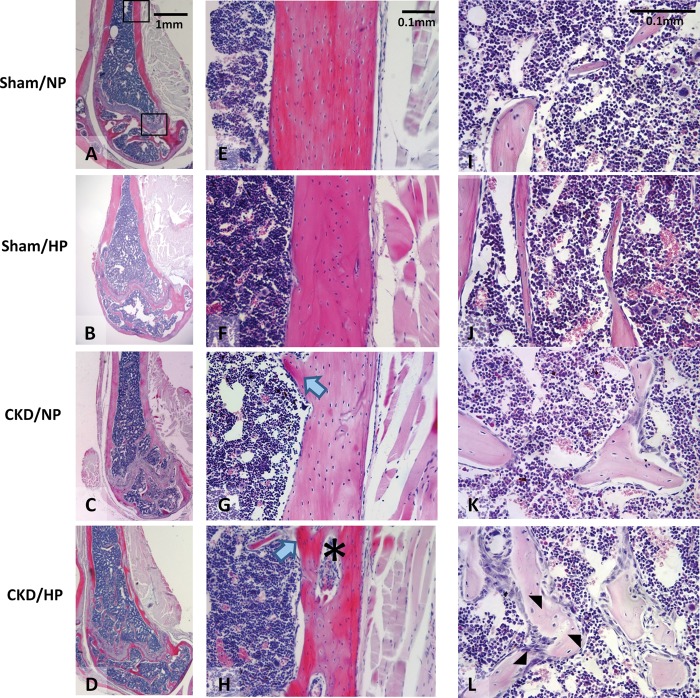
Results: In both NP and HP-fed CKD mice, elevated serum parathyroid hormone and alkaline phosphatase (ALP) levels were observed, but serum phosphorus levels were equivalent compared with sham controls. CKD mice on NP diet showed trabecular alterations in the long bone consistent with high-turnover ROD, including increased trabecular number with abundant osteoblasts and osteoclasts. Despite trabecular bone and serum biochemical changes, CKD/NP mice did not develop vascular calcification. In contrast, CKD/HP mice developed arterial medial calcification (AMC), more severe trabecular bone alterations and cortical bone abnormalities that included decreased cortical thickness and density, and increased cortical porosity. Cortical bone porosity and trabecular number strongly correlated with the degree of aortic calcification.
Conclusions: HP feeding was required to induce the full spectrum of CKD-MBD symptoms in CKD mice.
Figures
References
-
- Moe S, Drüeke T, Cunningham J, et al. Definition, evaluation, and classification of renal osteodystrophy: a position statement from kidney disease: improving klobal outcomes (KDIGO) Kidney Int. 2006;69:1945–1953. - PubMed
-
- Block G, Cunningham J. Morbidity and mortality associated with abnormalities in bone and mineral metabolism in CKD. In: Olgaard K, editor. Clinical Guide to the Basics of Bone and Mineral Metabolism in CKD. New York: National Kidney Foundation; 2006. pp. 77–92.
-
- Tonelli M, Wiebe N, Culleton B, et al. Chronic kidney disease and mortality risk: a systematic review. J Am Soc Nephrol. 2006;17:2034–2047. - PubMed
-
- Shroff R, McNair R, Figg N, et al. Dialysis accelerates medial vascular calcification in part by triggering smooth muscle cell apoptosis. Circulation. 2008;118:1748–1757. - PubMed
-
- González EA, Lund RJ, Martin KJ, et al. Treatment of a murine model of high-turnover renal osteodystrophy by exogenous BMP-7. Kidney Int. 2002;61:1322–1331. - PubMed
Publication types
MeSH terms
Substances
Grants and funding
LinkOut - more resources
Full Text Sources
Medical
Research Materials
Miscellaneous
