. 2012 Oct 22;209(11):2001-16.
doi: 10.1084/jem.20111497. Epub 2012 Oct 8.

Neuropilin 1 deficiency on CD4+Foxp3+ regulatory T cells impairs mouse melanoma growth

Affiliations

Neuropilin 1 deficiency on CD4+Foxp3+ regulatory T cells impairs mouse melanoma growth

Wiebke Hansen et al. J Exp Med. .

Abstract

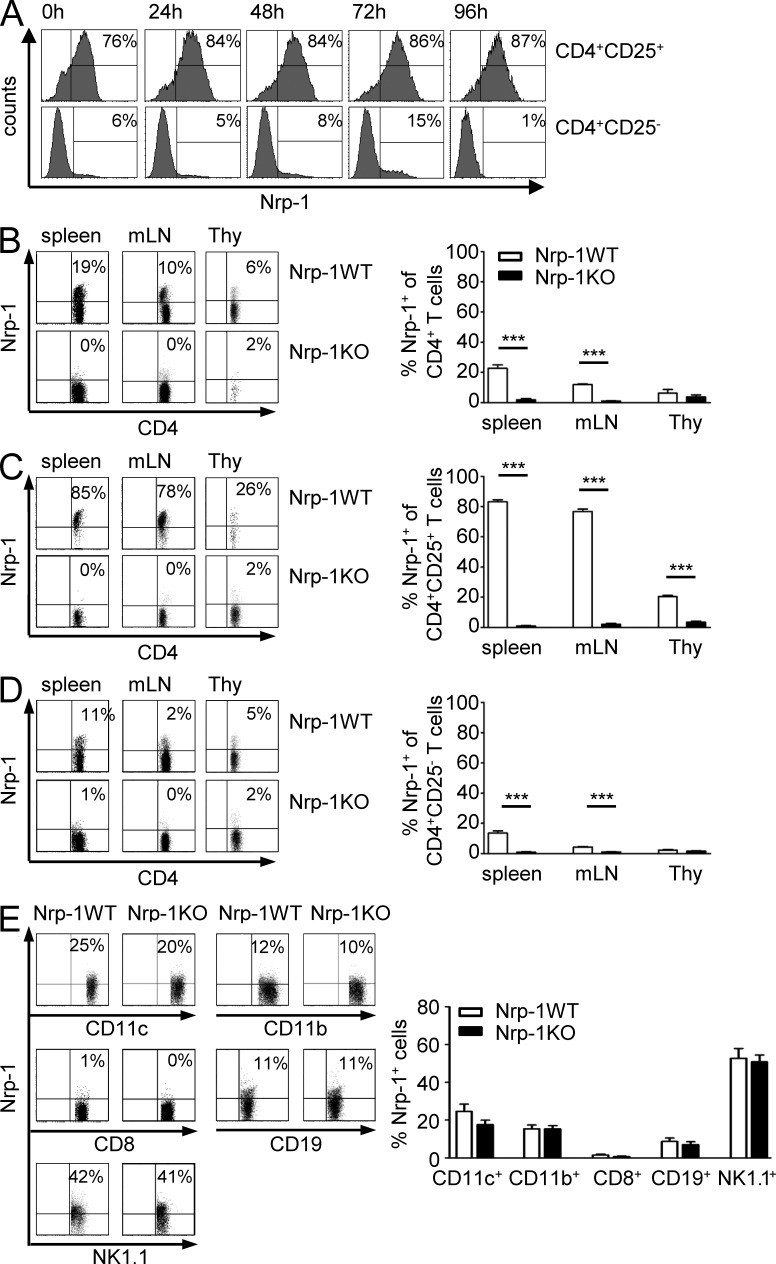
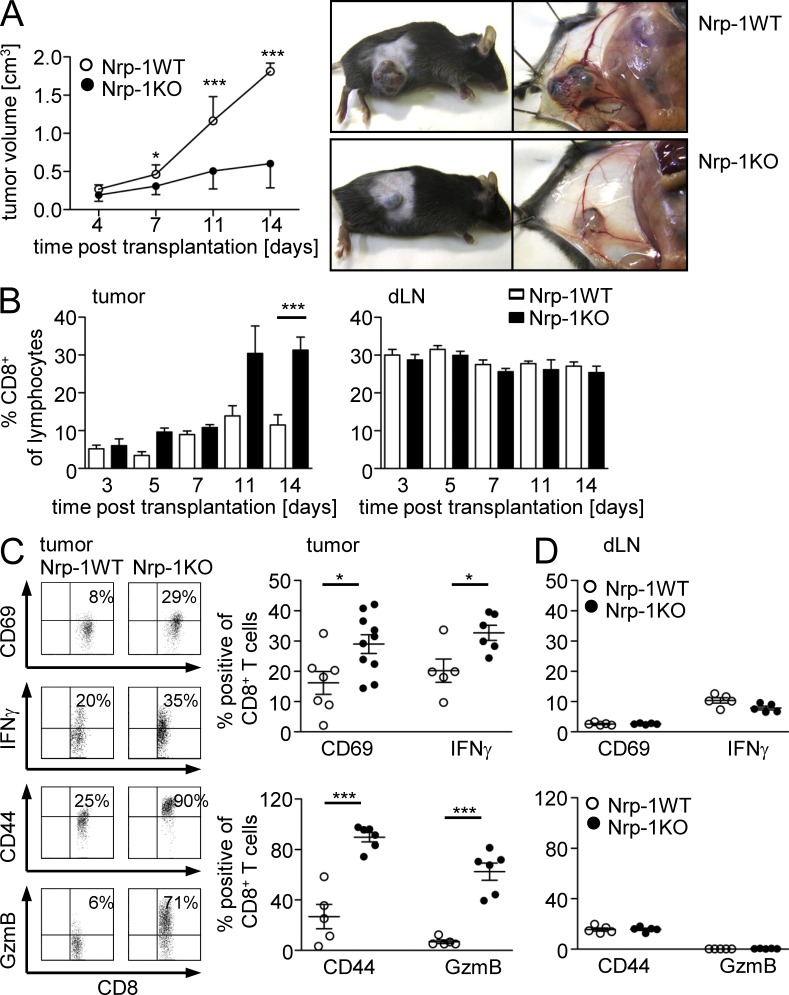
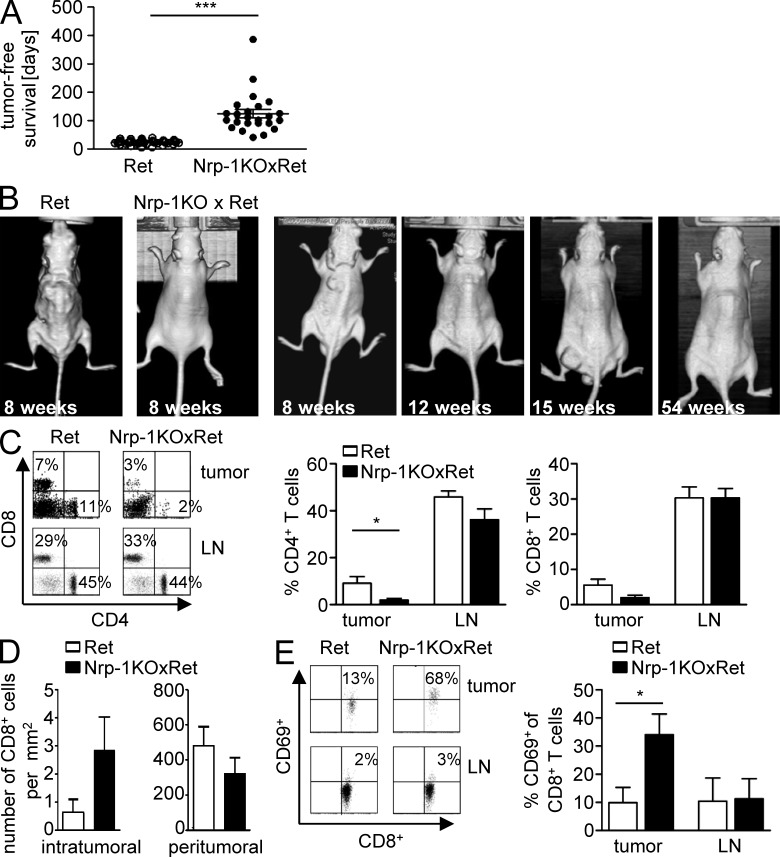
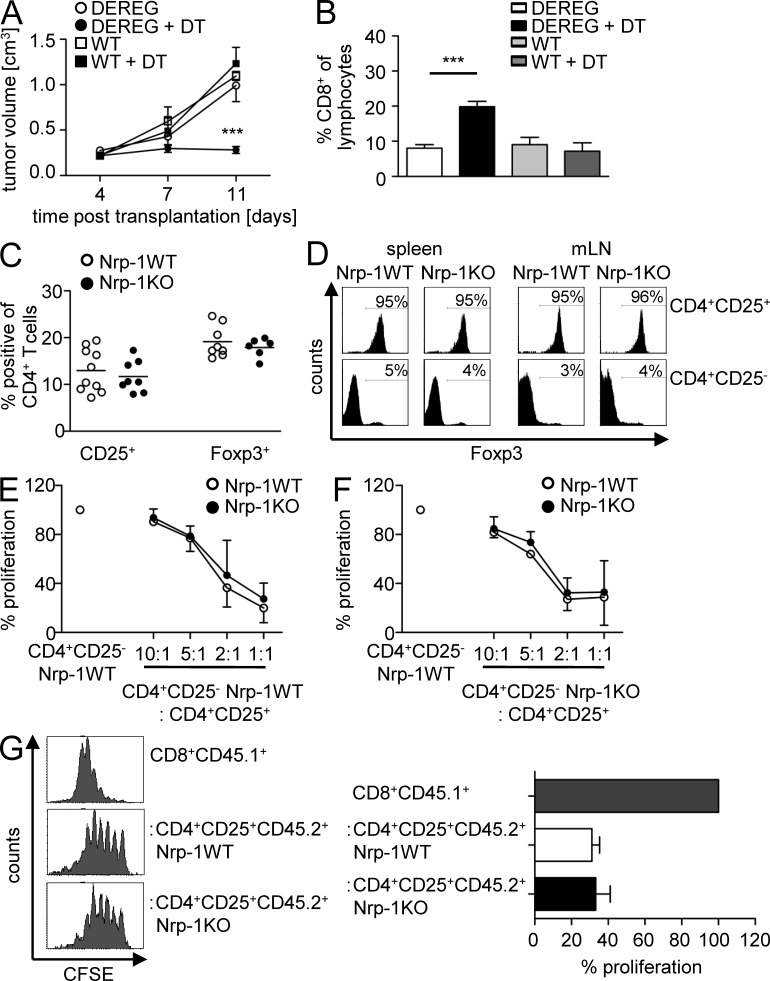
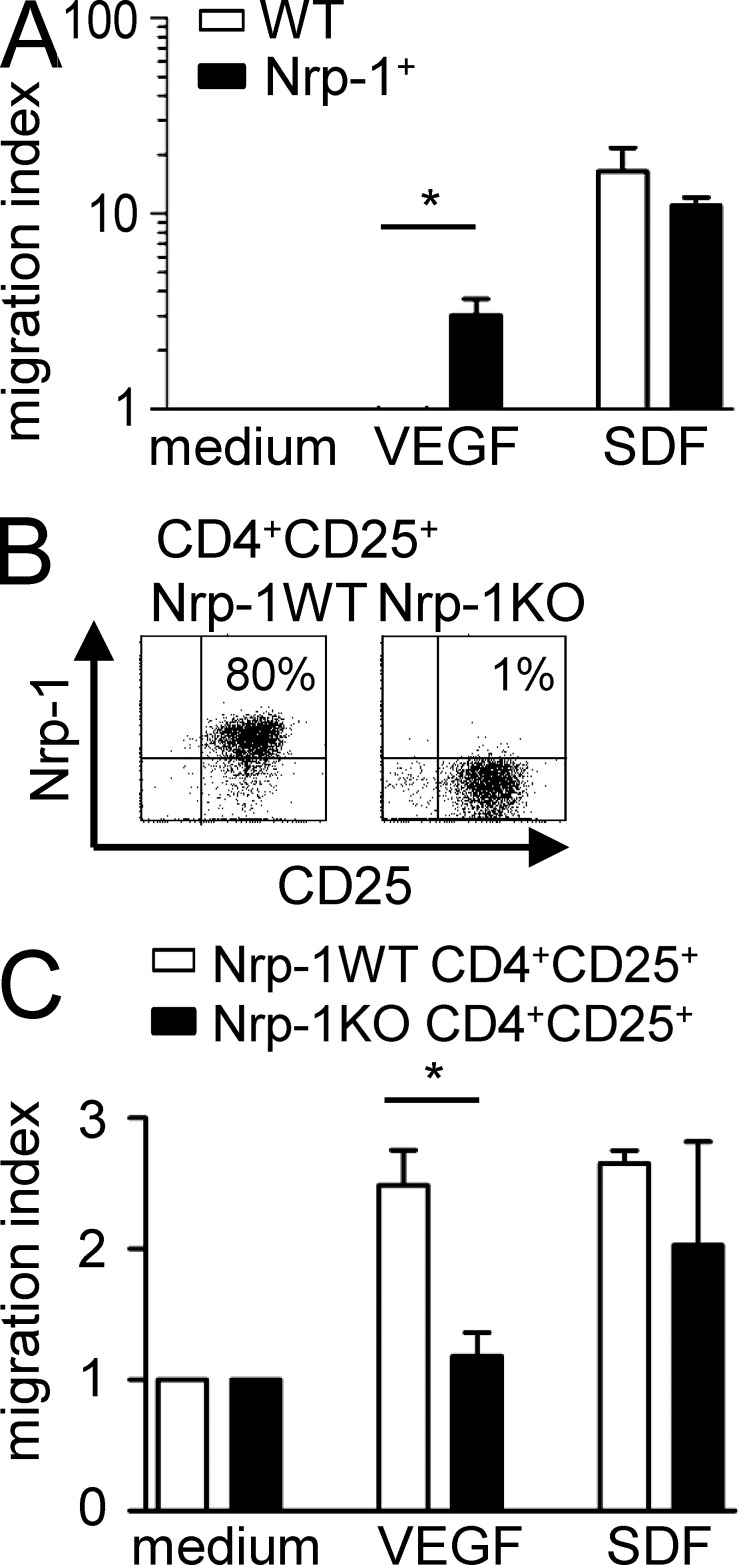
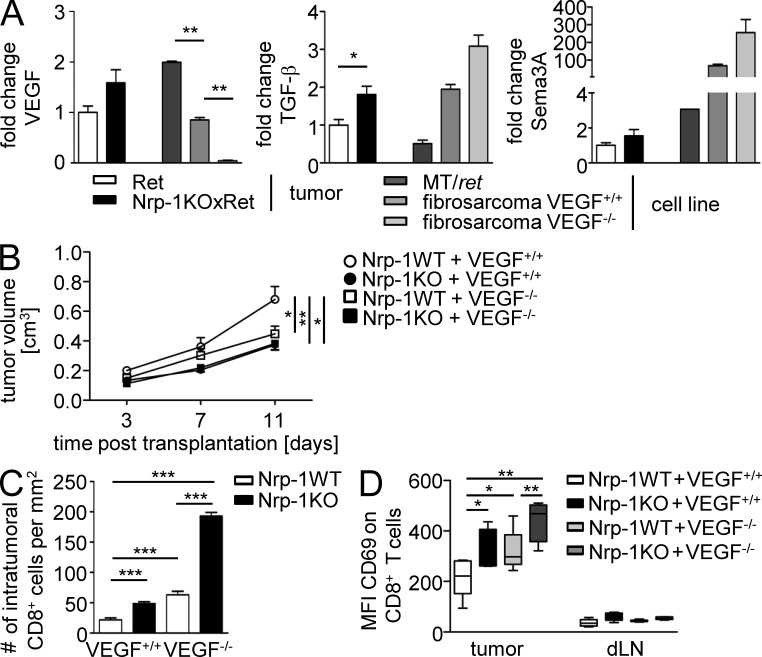
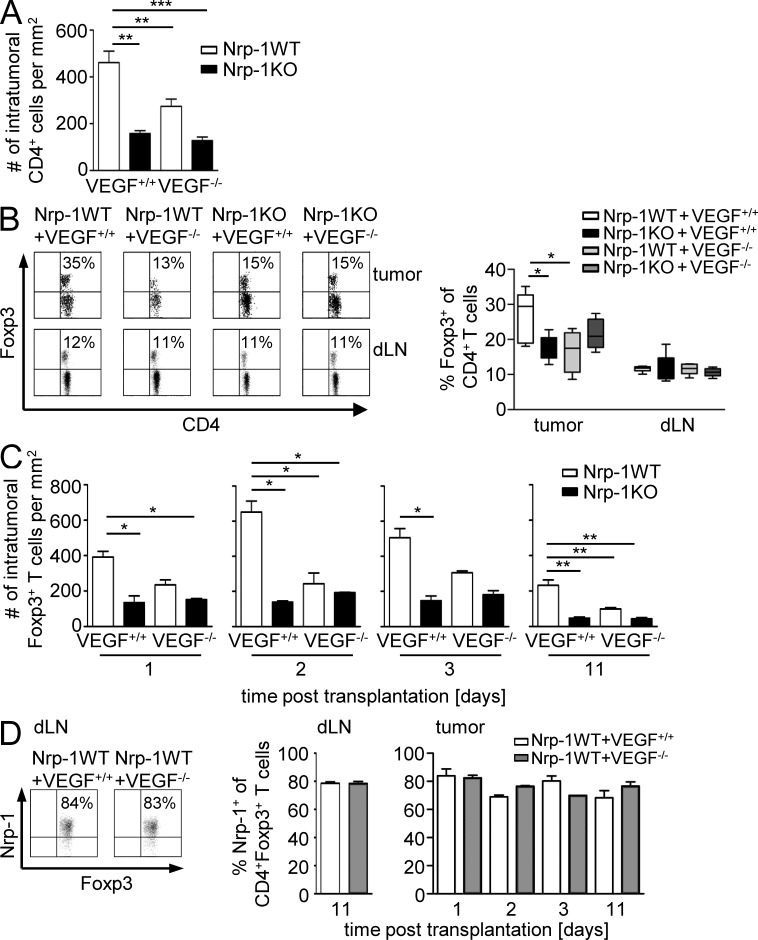
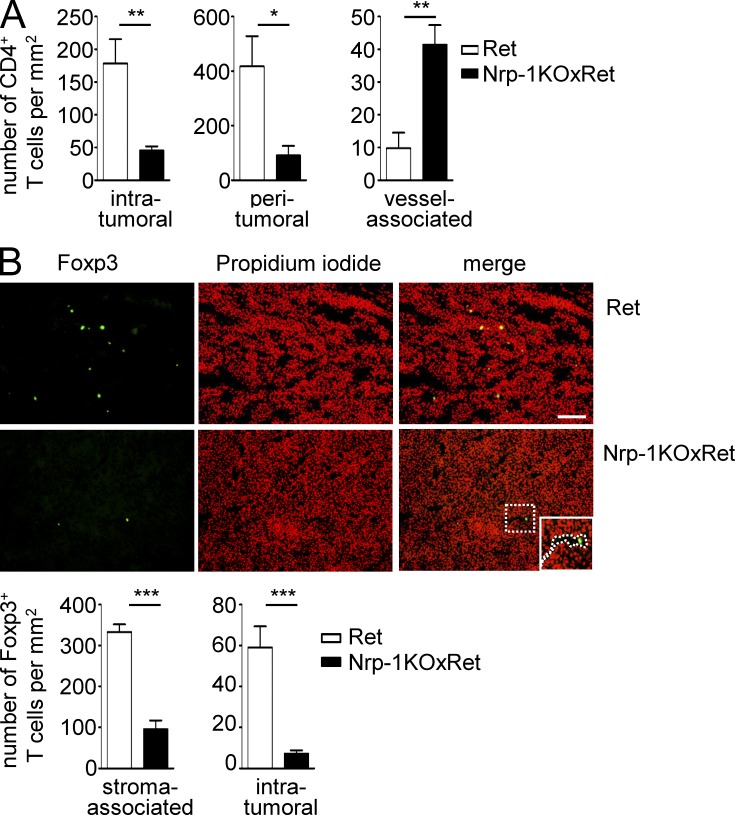
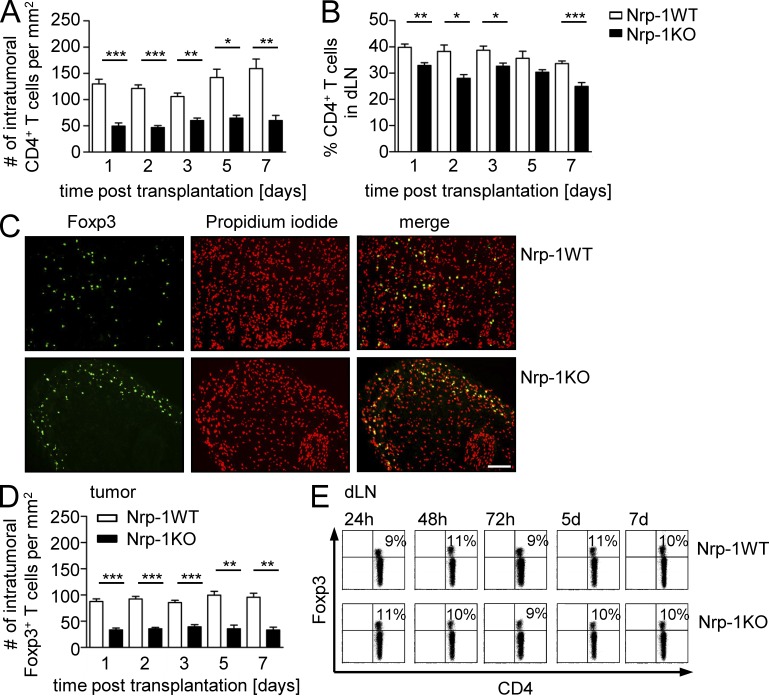
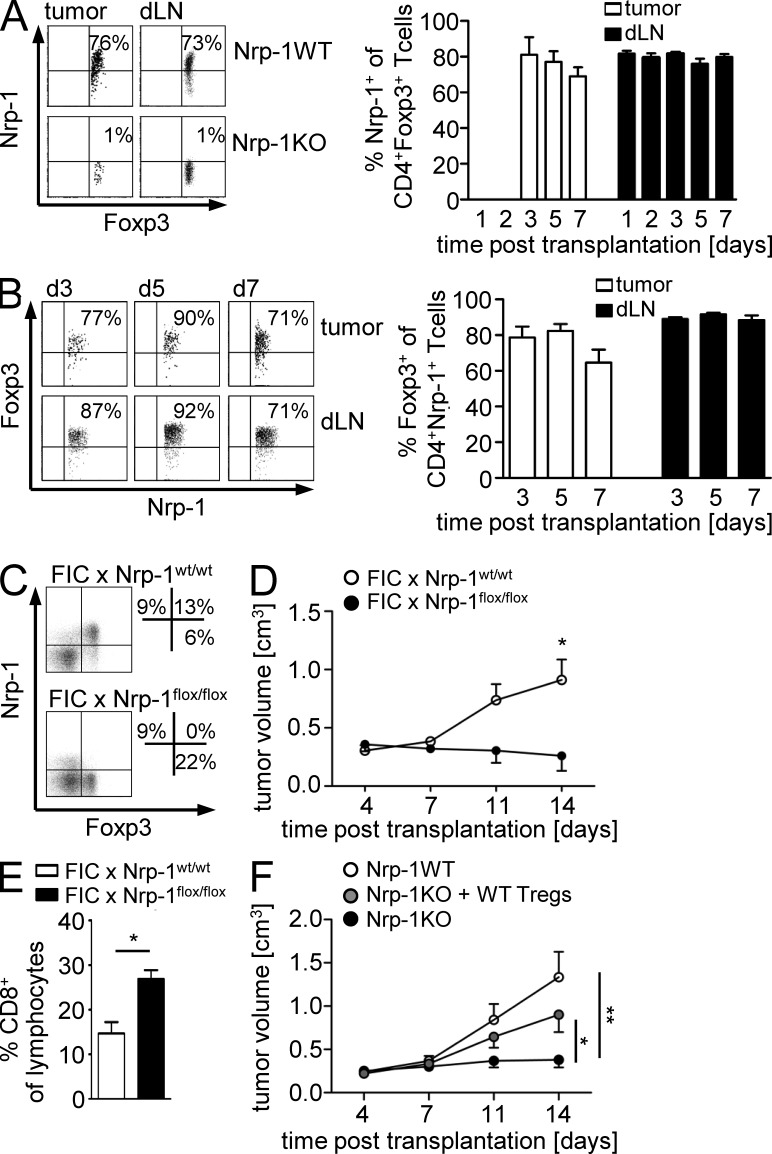
Infiltration of Foxp3(+) regulatory T (T reg) cells is considered to be a critical step during tumor development and progression. T reg cells supposedly suppress locally an effective anti-tumor immune response within tumor tissues, although the precise mechanism by which T reg cells infiltrate the tumor is still unclear. We provide evidence that Neuropilin 1 (Nrp-1), highly expressed by Foxp3(+) T reg cells, regulates the immunological anti-tumor control by guiding T reg cells into the tumor in response to tumor-derived vascular endothelial growth factor (VEGF). We demonstrate for the first time that T cell-specific ablation of Nrp-1 expression results in a significant breakdown in tumor immune escape in various transplantation models and in a spontaneous, endogenously driven melanoma model associated with strongly reduced tumor growth and prolonged tumor-free survival. Strikingly, numbers of tumor-infiltrating Foxp3(+) T reg cells were significantly reduced accompanied by enhanced activation of CD8(+) T cells within tumors of T cell-specific Nrp-1-deficient mice. This phenotype can be reversed by adoptive transfer of Nrp-1(+) T reg cells from wild-type mice. Thus, our data strongly suggest that Nrp-1 acts as a key mediator of Foxp3(+) T reg cell infiltration into the tumor site resulting in a dampened anti-tumor immune response and enhanced tumor progression.


Figures

Figure 1.
Figure 1.
CD4+ T cell–specific ablation of Nrp-1 expression in Nrp-1flox/flox × CD4-cre mice. (A) Sorted CD4+CD25+ T reg cells and CD4+CD25 T cells were stimulated in vitro with anti-CD3, anti-CD28, and IL-2 for 24, 48, 72, and 96 h or left untreated (0 h) before analysis of Nrp-1 expression by flow cytometry. Representative histograms from one experiment out of three with similar results are shown. (B–D) Percentages of Nrp-1–expressing CD4+ T cells (B), CD4+CD25+ T cells (C), or CD4+CD25 T cells (D) were determined in spleen, mLN, and thymus (Thy) of Nrp-1flox/flox × CD4-cre mice (black bars; Nrp-1KO) and WT mice (white bars; Nrp-1WT) by flow cytometry. Representative dot plots from one experiment are depicted on the left and mean values ± SEM from n = 7–11 mice analyzed in three independent experiments are shown on the right. (E) Nrp-1 expression on CD11c+, CD11b+, CD8+, CD19+, and NK1.1+ splenocytes isolated from Nrp-1KO mice (black bars) and Nrp-1WT mice (white bars) analyzed by flow cytometry. Results from two independent experiments (n = 7–8 mice) are depicted as mean ± SEM. ***, P < 0.001 (Student’s t test).
Figure 2.
Figure 2.
Delay in tumorigenesis of transplanted tumors to T cell–specific Nrp-1–deficient mice is accompanied by activation of intratumoral CD8+ T cells. (A) Tumor growth curves of either Nrp-1flox/flox × CD4-cre mice (Nrp-1KO; black circles) or WT mice (Nrp-1WT; white circles) at days 4, 7, 11, and 14 after s.c. transplantation of MT/ret–derived tumor cells are shown as mean ± SEM from two independent experiments (n = 4–5 mice per experiment; left). Representative pictures are shown of individual tumor-bearing Nrp-1WT and Nrp-1KO mice at 14 d p.t. using MT/ret cells (right). (B) The amount of CD8+ T cells within TILs (left) or dLN cells (right) was determined at days 3, 5, 7, 11, and 14 p.t. of MT/ret tumor cells in Nrp-1KO mice (black bars) or Nrp-1WT mice (white bars) by flow cytometry. Results are shown as mean ± SEM of n = 3–10 mice analyzed in one or two independent experiments, respectively. (C and D) The amount of CD69, IFN-γ, CD44, and granzyme B (GzmB) expressing CD8+ tumor-infiltrating T cells (C) or CD8+ dLN cells (D) was analyzed 14 d p.t. of MT/ret tumor cells in Nrp-1KO mice (black circles) or Nrp-1WT mice (white circles) by flow cytometry. Representative dot plots from flow cytometric analysis of CD8+ T cells from tumor tissues of Nrp-1WT and Nrp-1KO are shown (C, left). Each data point represents one animal analyzed in one or two (CD69) experiments, respectively. Error bars represent ±SEM. Horizontal bars show the mean. *, P < 0.05; ***, P < 0.001 (Student’s t test).
Figure 3.
Figure 3.
Prolonged tumor-free survival and reduced tumor development of MT/ret mice deficient in T cell–specific Nrp-1 expression. Nrp-1flox/flox × CD4-cre mice were crossed with MT/ret mice. (A) Scatter plot for the age of mice until melanomas were palpable in either MT/ret (white circles; Ret) or Nrp-1flox/flox × CD4-cre mice × MT/ret (black circles; Nrp-1KOxRet). Each data point represents one animal (n = 42 Ret, n = 26 Nrp-1KOxRet mice). Error bars represent ±SEM. (B) Representative pictures for the assessment of tumor development during life in Ret and Nrp-1KOxRet mice at indicated time points using CT. (C) The percentage of CD4+ and CD8+ T cells on gated lymphocytes within the tumor and LN was determined by flow cytometry. Representative dot plots are shown on the left and summarized results from n = 4–5 mice analyzed in four independent experiments are shown as mean ± SEM in the middle (CD4+ T cells) and on the right (CD8+ T cells). (D) Immunofluorescence-based quantification for the number of intratumoral and peritumoral CD8+ T cells within Ret (n = 6) and Nrp-1KOxRet (n = 8) mice. A total of five regions of interest (ROI) per tumor were evaluated. Means were calculated for all ROI. Data are summarized as mean ± SEM of two independent experiments. (E) CD69-expressing cells on gated CD8+ T cells were determined in tumors (n = 5 mice) and LN (n = 3 mice) of Ret- and Nrp-1KOxRet-transgenic mice by flow cytometry. Representative dot plots are shown on the left, and summarized results as mean ± SEM of n = 3–5 mice analyzed in three independent experiments are on the right. *, P < 0.05; ***, P < 0.001 (Student’s t test).
Figure 4.
Figure 4.
Foxp3+ T reg cells contribute to tumor growth, but Nrp-1 expression by Foxp3+ T reg cells is dispensable for their development and immunosuppressive function. (A and B) DT-treated (black circles) or untreated (white circles) DEREG mice and DT-treated (black squares) or untreated (white squares) WT mice were transplanted s.c. with MT/ret melanoma cells. Tumor volume was measured at days 3, 7, and 11 p.t. (A) and the percentage of CD8+ T cells within the tumors was assessed by flow cytometry at day 11 p.t. (B). Results from two independent experiments are summarized as mean ± SEM (n = 2–5 mice per group and experiment). (C) Percentages of CD25 and Foxp3-expressing CD4+ splenocytes of Nrp-1flox/flox × CD4-cre mice (black circles; Nrp-1KO) and WT mice (white circles; Nrp-1WT) determined by flow cytometry. Each data point represents one animal analyzed in three independent experiments. Horizontal bars show the mean. (D) Percentages of Foxp3-expressing CD4+CD25+ (top) and CD4+CD25 T cells (bottom) isolated from spleen or mLN of Nrp-1KO mice and Nrp-1WT mice were analyzed by flow cytometry. Representative data from one experiment out of three with similar results are shown. (E and F) Sorted CD4+CD25 T cells from Nrp-1WT mice (n = 3–4; E) or Nrp-1KO mice (n = 3–4; F) were cultured alone or co-cultured with increasing numbers of CD4+CD25+ T reg cells from Nrp-1KO mice (black circles) and Nrp-1WT mice (white circles) in the presence of anti-CD3 and irradiated splenocytes as APCs. Proliferation was measured by 3[H] incorporation. Results from two to three independent experiments performed in triplicate were summarized with respect to CD4+CD25 WT T cells (set as 100%) ± SEM. (G) CD8+ T cells were sorted from CD45.1+ WT mice, labeled with CFSE, and either cultured alone (gray bars) or co-cultured with CD45.2+CD4+CD25+ T reg cells from Nrp-1WT (white bars) or Nrp-1KO (black bars) in the presence of anti-CD3 and irradiated splenocytes. Proliferation was assessed at day 3 by loss of CFSE on gated CD45.1+CD8+ responder T cells. Histograms of one out of two independent experiments are shown on the left and data are summarized as mean ± SEM with respect to CD8+ responder T cells (set as 100%; right). ***, P < 0.001 (Students t test).
Figure 5.
Figure 5.
Nrp-1+ cells migrate toward VEGF in vitro. (A and C) The Nrp-1 deficient hybridoma cell line 16.2.11 was transduced with an Nrp-1 encoding retroviral vector (Nrp-1+). Nrp-1 (WT; white bars; A) or Nrp-1+ cells (black bars; A), or freshly isolated CD4+CD25+ T reg cells from Nrp-1WT mice (white bars; C) or Nrp-1KO mice (black bars; C) were seeded in the upper chamber of a transwell system. The lower chamber contained medium alone (negative control), recombinant VEGF, or recombinant SDF as positive control. The migration index was calculated with regard to cell number counted in the lower chamber of negative control (set as 1). Results from two to three independent experiments are depicted as mean ± SEM. *, P < 0.05 (Student’s t test). (B) Expression levels of CD25 and Nrp-1 on isolated CD4+CD25+ T reg cells from Nrp-1WT and Nrp-1KO mice were determined by flow cytometry.
Figure 6.
Figure 6.
VEGF ablation in tumor cells resembles a similar phenotype as T cell–specific deletion of Nrp-1 expression. (A) VEGF (left), TGF-β (middle), and Sema 3A (right) mRNA expression levels were determined in tumor tissues from Ret mice (white bars) and Nrp-1KOxRet mice (black bars), as well as in the MT/ret melanoma cell line (dark gray bars), VEGF+/+ (gray bars), and VEGF−/− (light gray bars) fibrosarcoma cell lines by real-time PCR. Fold changes in expression levels were calculated with regard to expression level in tumors from Ret mice (set as 1). Results from two to three independent experiments are summarized as ± SEM (n = 2 tumors). (B) VEGF+/+ (circles) or VEGF−/− (squares) fibrosarcoma cells were injected s.c. either to Nrp-1flox/flox × CD4-cre mice (black symbols; Nrp-1KO) or to WT mice (white symbols; Nrp-1WT). Volumes of transplanted tumors to Nrp-1WT mice and Nrp-1KO mice were measured at days 3, 7, and 11 p.t. Results from two independent experiments are summarized as mean ± SEM (n = 3–4 mice per group). (C) Immunohistochemical assessment of intratumoral CD8+ T cells from Nrp-1WT (n = 6) and Nrp-1KO mice (n = 4) at day 11 p.t. with VEGF+/+ or VEGF−/− tumor cells. Data are summarized as mean ± SEM of two independent experiments. (D) The CD69 expression level (mean fluorescence intensity = MFI) on gated CD8+ T cells within the tumor tissue and the dLN of Nrp-1WT or Nrp-1KO mice that received VEGF+/+ or VEGF−/− fibrosarcoma cells was determined by flow cytometry at day 11 p.t. Results from two independent experiments with n = 2–3 mice per group and experiment are depicted as mean ± SEM. *, P < 0.05; **, P < 0.01; ***, P < 0.001 (Student’s t test).
Figure 7.
Figure 7.
Host T cell–expressed Nrp-1 and tumor-derived VEGF modulate Foxp3+ T reg cell infiltration into tumors. (A) Immunohistochemical assessment of intratumoral CD4+ T cells into Nrp-1WT (white bars, n = 6) and Nrp-1KO mice (black bars, n = 4) at day 11 p.t. with VEGF+/+ or VEGF−/− tumor cells. Data are summarized as mean ± SEM of two independent experiments. (B) Percentages of Foxp3-expressing CD4+ T cells within tumor tissues and dLN from Nrp-1WT of Nrp-1KO mice that were transplanted with either VEGF+/+ or VEGF−/− tumor cells were analyzed by flow cytometry at day 11 p.t. Results from one out of two independent experiments with n = 2–3 mice (per group and experiment) are shown (left) and summarized as mean ± SEM (right). (C) Immunohistochemically based quantification for tumor-infiltrating Foxp3+ T cells in Nrp-1WT mice (white bars) and Nrp-1KO mice (black bars) at days 1, 2, 3, and 11 after s.c. transplantation of VEGF+/+ or VEGF−/− tumor cells. Data are summarized as mean ± SEM (n = 2–6 mice per group per indicated time point). (D) The frequency of Nrp-1–expressing Foxp3+ T reg cells from Nrp-1WT mice that were transplanted with either VEGF+/+ (white bars) or VEGF−/− (gray bars) tumor cells was determined within tumors by immunohistochemistry (n = 2–6) and in dLN by flow cytometry on gated CD4+Foxp3+ cells. Representative dot plots from one flow cytometric analysis out of two independent experiments with n = 2–4 mice (per group and experiment; left) and summarized data are shown as mean ± SEM (right). *, P < 0.05; **, P < 0.01; ***, P < 0.001 (Student’s t test).
Figure 8.
Figure 8.
Impaired Foxp3+ T reg cell tumor infiltration in MT/ret mice deficient in T cell–specific Nrp-1 expression. Nrp-1flox/flox × CD4-cre mice were crossed with MT/ret mice. (A) Immunohistochemically based quantification of intratumoral, peritumoral, and vessel-associated CD4+ T cells in MT/ret (Ret; n = 6 tumors of four mice) and Nrp-1flox/flox × CD4-cre mice × MT/ret (Nrp-1KOxRet; n = 8 tumors of four mice) summarized as mean ± SEM. (B) Representative picture of immunohistologically based detection of Foxp3+ T reg cell infiltration (green) into Ret and Nrp-1KOxRet tumors. Nuclei were counterstained using propidium iodide. Quantification for the number of Foxp3+ T cells recruited to the tumor-associated stroma or into the center of Ret (white bars) or Nrp-1KOxRet (black bars) tumors (intratumoral). Data are shown as mean ± SEM from three independent experiments (n = 9–12 tumors from three mice, Ret; n = 6–9 tumors from three mice, Nrp-1KOxRet). Bar, 100 µm. Dotted line: intratumoral vessel. *, P < 0.05; **, P < 0.001; ***, P < 0.0001 (Student’s t test).
Figure 9.
Figure 9.
Decreased number of intratumoral CD4+ and Foxp3+ T cells in T cell–specific Nrp-1–deficient mice upon transplantation of MT/ret cells. (A and B) Immunohistochemically based quantification of intratumoral CD4+ T cells (A) and percentages of CD4+ T cells within the dLN (B) analyzed by flow cytometry of Nrp-1flox/flox × CD4-cre mice (black bars; Nrp-1KO) or WT mice (open bars; Nrp-1WT) at days 1, 2, 3, 5, and 7 d after s.c. transplantation of MT/ret cells are shown as mean ± SEM (n = 2–6 mice per time point and group of at least two independent experiments at days 3, 5, and 7). (C) Representative pictures of Foxp3+ T reg cell infiltration into tumors of Nrp-1WT and Nrp-1KO mice 24 h p.t. of MT/ret cells by immunohistochemistry (green). Nuclei were counterstained using propidium iodide (red). Bar, 100 µm. Data are representative of at least two independent experiments. (D) Immunohistochemically based quantification of Foxp3+ T cells in tumor sections of Nrp-1KO mice (black bars) or Nrp-1WT mice (white bars) at days 1, 2, 3, 5, and 7 d p.t. of MT/ret cells shown as mean ± SEM (n = 2 to 6 mice per time point and group of at least two independent experiments at days 3, 5, and 7). (E) Percentages of Foxp3+ T reg cells in dLN of Nrp-1WT or Nrp-1KO mice that received MT/ret cells analyzed by flow cytometry on gated CD4+ T cells. Representative dot plots from one experiment out of two with similar results (n = 2–5 per time point and group) are shown. *, P < 0.05; **, P < 0.01; ***, P < 0.001 (Student’s t test).
Figure 10.
Figure 10.
Foxp3-specific ablation of Nrp-1 expression results in impaired tumor growth and adoptive transfer of Nrp-1+ T reg cells reverses the phenotype of tumor-bearing Nrp-1KO mice. (A) Nrp-1 expression on gated CD4+Foxp3+ T reg cells isolated from tumors (white bars) and dLN (black bars) of WT mice (Nrp-1WT) and Nrp-1flox/flox × CD4-cre mice (Nrp-1KO) mice that received MT/ret cells at different time points p.t. as indicated. Representative results from one experiment (day 5 p.t.) are shown (left) and data from one to three experiments with n = 2–3 Nrp-1WT mice (per time point and experiment) are summarized as mean ± SEM (right). (B) Percentages of Foxp3-expressing Nrp-1+CD4+ T cells were analyzed by flow cytometry at days 3, 5, and 7 p.t. in tumors (white bars) and dLN (black bars) of Nrp-1WT mice that were transplanted with MT/ret cells. Representative dot plots (left) and results from two independent experiments (n = 3 mice per experiment) are summarized as mean ± SEM (right). (C) Foxp3 and Nrp-1 expression on gated CD4+ T cells from spleen of FIC × Nrp-1flox/flox and FIC × Nrp-1wt/wt mice were analyzed by flow cytometry. (D) FIC × Nrp-1flox/flox mice (black circles) and FIC × Nrp-1wt/wt mice (white circles) were transplanted with CT-26 tumor cells s.c. Tumor volumes were monitored at days 4, 7, 11, and 14 p.t. and are shown as mean ± SEM from one out of two independent experiments (n = 3–5 mice). (E) The percentages of tumor-infiltrating CD8+ T cells were determined in MT/ret transplanted FIC × Nrp-1flox/flox mice (black bars) and FIC × Nrp-1wt/wt mice (white bars) at day 14 p.t. by flow cytometry and summarized as mean ± SEM from two independent experiments (n = 3–5 mice). (F) Nrp-1WT and Nrp-1KO mice were transplanted with MT/ret cells and one group of transplanted Nrp-1KO mice were additionally injected with WT T reg cells. Tumor volumes were monitored at days 4, 7, 11, and 14. Results from four independent experiments with n = 8–11 mice (per group in total) are shown as mean ± SEM. *, P < 0.05; **, P < 0.01 (Student’s t test).

References

    1. Andreu P., Johansson M., Affara N.I., Pucci F., Tan T., Junankar S., Korets L., Lam J., Tawfik D., DeNardo D.G., et al. 2010. FcRgamma activation regulates inflammation-associated squamous carcinogenesis. Cancer Cell. 17:121–134 10.1016/j.ccr.2009.12.019 - DOI - PMC - PubMed
    1. Antony P.A., Piccirillo C.A., Akpinarli A., Finkelstein S.E., Speiss P.J., Surman D.R., Palmer D.C., Chan C.C., Klebanoff C.A., Overwijk W.W., et al. 2005. CD8+ T cell immunity against a tumor/self-antigen is augmented by CD4+ T helper cells and hindered by naturally occurring T regulatory cells. J. Immunol. 174:2591–2601 - PMC - PubMed
    1. Balkwill F., Coussens L.M. 2004. Cancer: an inflammatory link. Nature. 431:405–406 10.1038/431405a - DOI - PubMed
    1. Battaglia A., Buzzonetti A., Monego G., Peri L., Ferrandina G., Fanfani F., Scambia G., Fattorossi A. 2008. Neuropilin-1 expression identifies a subset of regulatory T cells in human lymph nodes that is modulated by preoperative chemoradiation therapy in cervical cancer. Immunology. 123:129–138 10.1111/j.1365-2567.2007.02737.x - DOI - PMC - PubMed
    1. Bielenberg D.R., Pettaway C.A., Takashima S., Klagsbrun M. 2006. Neuropilins in neoplasms: expression, regulation, and function. Exp. Cell Res. 312:584–593 10.1016/j.yexcr.2005.11.024 - DOI - PubMed

Publication types

MeSH terms

Substances