. 2012 Oct 22;209(11):2049-64.
doi: 10.1084/jem.20111504. Epub 2012 Oct 8.

B and T cells collaborate in antiviral responses via IL-6, IL-21, and transcriptional activator and coactivator, Oct2 and OBF-1

Affiliations

B and T cells collaborate in antiviral responses via IL-6, IL-21, and transcriptional activator and coactivator, Oct2 and OBF-1

Alex Karnowski et al. J Exp Med. .

Abstract

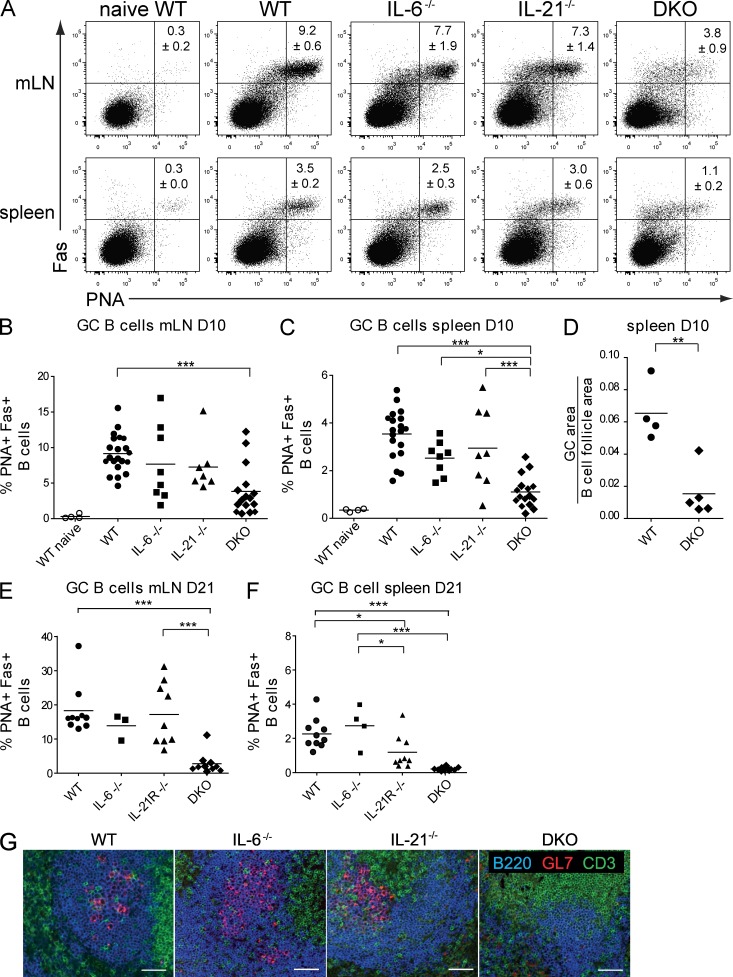
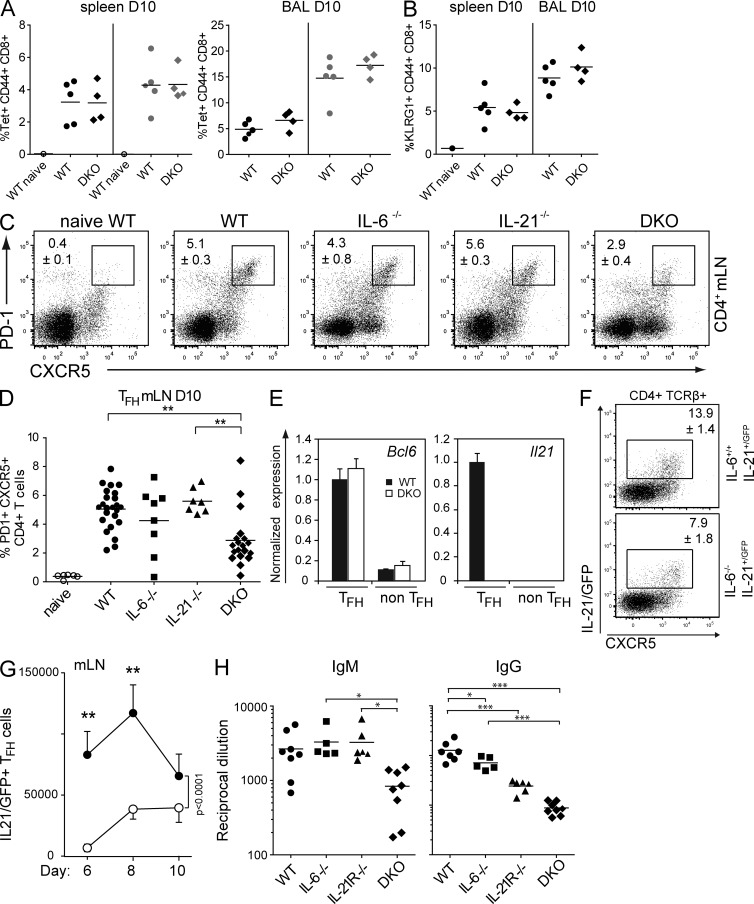
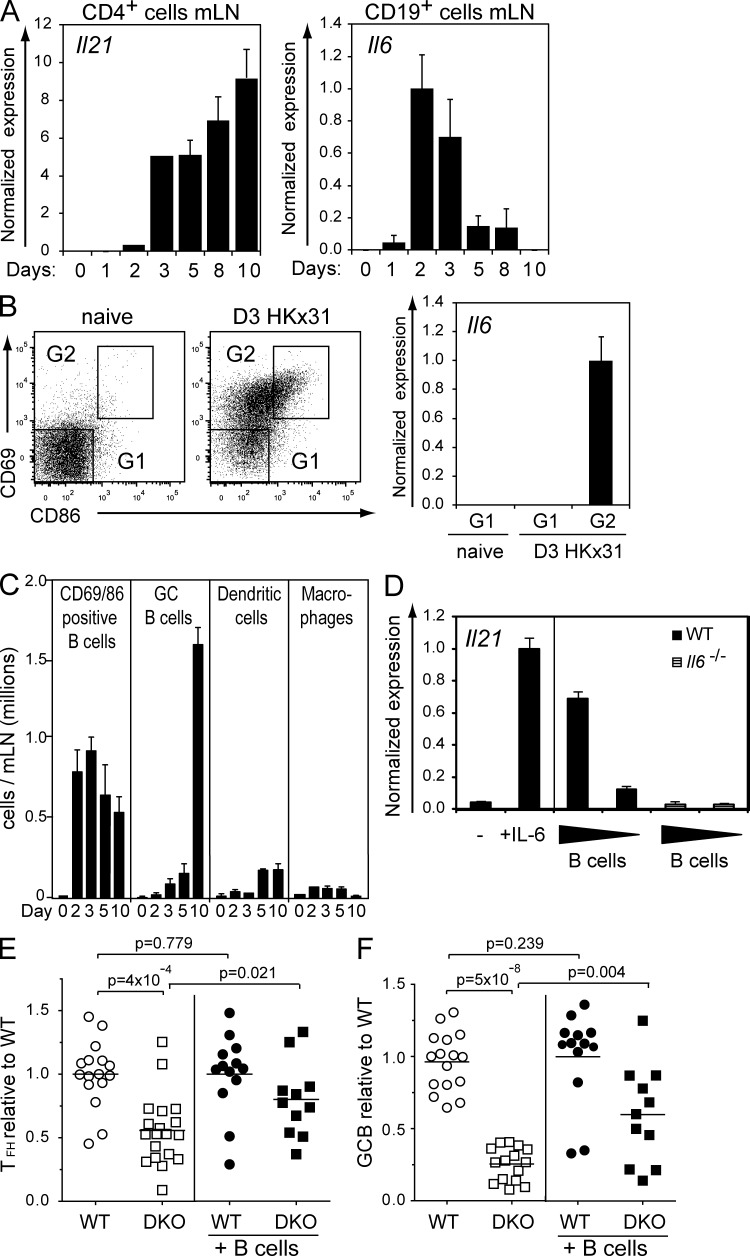
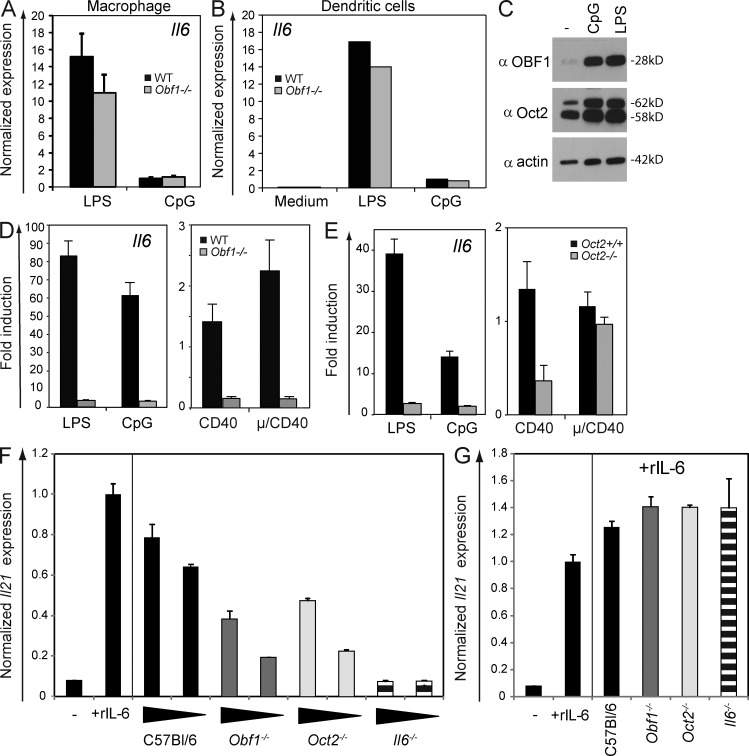
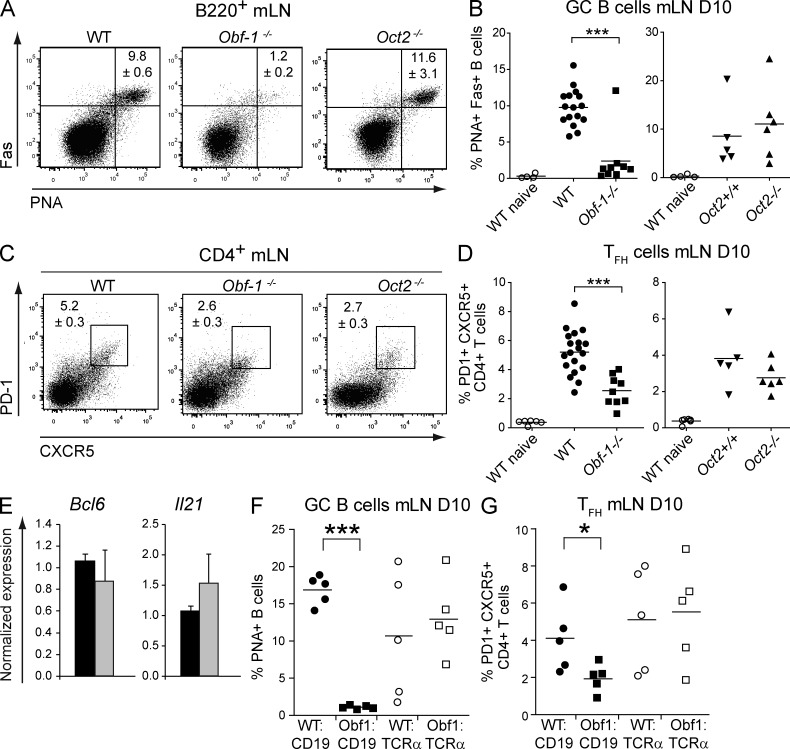
A strong humoral response to infection requires the collaboration of several hematopoietic cell types that communicate via antigen presentation, surface coreceptors and their ligands, and secreted factors. The proinflammatory cytokine IL-6 has been shown to promote the differentiation of activated CD4(+) T cells into T follicular helper cells (T(FH) cells) during an immune response. T(FH) cells collaborate with B cells in the formation of germinal centers (GCs) during T cell-dependent antibody responses, in part through secretion of critical cytokines such as IL-21. In this study, we demonstrate that loss of either IL-6 or IL-21 has marginal effects on the generation of T(FH) cells and on the formation of GCs during the response to acute viral infection. However, mice lacking both IL-6 and IL-21 were unable to generate a robust T(FH) cell-dependent immune response. We found that IL-6 production in follicular B cells in the draining lymph node was an important early event during the antiviral response and that B cell-derived IL-6 was necessary and sufficient to induce IL-21 from CD4(+) T cells in vitro and to support T(FH) cell development in vivo. Finally, the transcriptional activator Oct2 and its cofactor OBF-1 were identified as regulators of Il6 expression in B cells.


Figures

Figure 1.
Figure 1.
Combined loss of IL-6 and IL-21 compromises GC formation in influenza infection. Analysis of GC B cells in C57BL/6 (WT), IL-6, IL-21, and IL-6/IL-21 double-deficient mice (DKO). Mice were analyzed on day 10 after influenza infection. Results shown are from three to six independent experiments, totaling 4 naive WT and 21 WT, 8 Il6−/−, 8 Il21−/−, and 16 DKO-infected mice, respectively. (A) Cells from the draining mLNs and from the spleen were stained for GC B cells with α-B220, α-Fas, and PNA, and the percentage of B220+ cells that were also PNA+/Fas+ is shown. (B and C) Frequency distribution of GC B cells in spleens and mLNs from WT and mutant mice analyzed on day 10 of infection. (D) Ratio of GC area to B cell follicle area in spleens of WT and DKO animals on day 10, as measured from histological sections. Each symbol represents an individual animal. (E and F) Frequency distribution of GC B cells from WT and mutant mice analyzed on day 21 of infection. Each symbol represents an individual animal. Statistical analyses used Tukey’s multiple comparison tests. ***, P < 0.001; **, P = 0.001–0.001; *, P = 0.01–0.05. Bars and numbers show mean percentage with ± SEM. Results are from three to six independent experiments. (G) Representative histological staining to detect GCs in spleens from control or mutant mice 10 d after influenza infection. Paraffin sections were stained with α-GL7, α-B220, and α-CD3. Bars, 50 µm.
Figure 2.
Figure 2.
Combined loss of IL-6 and IL-21 does not affect the virus-specific CD8 response but limits TFH formation and the antibody response in influenza infection. Analysis of anti-influenza CD8 responses in WT and DKO animals. Mice were analyzed on day 10 after infection. (A) Splenocytes and cells from the bronchoalveolar lavage (BAL) were stained with α-CD8, α-CD44, and either NP-tetramer or PA-tetramer. Frequency distribution of splenic, virus-specific CD8+ T cells (tetramer stains: NP, black symbols; PA, gray symbols) is shown in a representative of two independent experiments using three to five animals of each genotype. (B) Frequency distribution of KLRG1/CD44 double-positive CD8+ T cells in spleen and bronchoalveolar lavage. Each symbol represents an individual animal. Bars and numbers show mean percentage with ± SEM. (C) WT, IL-6– or IL-21–deficient, and DKO mice were infected with HKx31 influenza virus and analyzed on day 10 after infection. Cells from the mLNs were stained for TFH cells with α-CD4, α-CXCR5, and α–PD-1, and the percentage of PD-1/CXCR5 double-positive CD4+ T cells was measured. (D) Frequency of TFH from WT and mutant mice analyzed on day 10 after infection. Representative example shown of two to six independent experiments, totaling 6 naive WT, 23 WT, 8 Il6−/−, 8 Il21−/−, and 19 DKO-infected mice, respectively. (E) CD4+PD-1+CXCR5+ TFH cells and CD4+PD-1CXCR5 T cells were sorted from spleen on day 14 of HKx31 influenza infection. Bcl6 and Il21 expression was measured by RT-qPCR. (As expected, Il21 is not expressed in the DKO mice. This is a control only.) Bars and numbers show relative gene expression normalized to the housekeeping gene, Hmbs, ± SEM (n = 3). (F) IL-21–GFP reporter mice, on a WT or Il6−/− background, were infected, and mLNs were harvested on days 6, 8, and 10 and stained for TFH cells (CD4, TCR-β, CXCR5, and PD-1). The dot plot shows IL-21–expressing cells in the CD4+/TCR-β+ gate on day 10. (G) Time course showing total numbers of IL-21–expressing TFH in the draining mLNs from days 6 to 10 of infection. Numbers show means ± SEM of five animals in each group. IL-21/GFP+ cells were also CD4+, TCR-β+, PD-1+, CXCR5+. (H) IgM and IgG HKx31-specific responses in WT, IL-6, IL-21R, and DKO mice. Serum IgM and IgG titers were measured by ELISA on day 14 of the influenza infection and are represented as the reciprocal of serum dilutions, giving an absorbance that was 50% of maximum value for the assay. Each symbol represents an individual animal. ***, P < 0.001; **, P = 0.001–0.001; *, P = 0.01–0.05. Bars and numbers show mean dilution ± SEM.
Figure 3.
Figure 3.
IL-6 and IL-21 are expressed early during an influenza infection. (A) CD4+ and CD19+ cells were isolated from mLNs on the indicated days after influenza infection. Il21 or Il6 mRNA expression was measured by qPCR. (B) Cells from the mLNs of naive and infected animals were stained with α-CD19, α-CD11c, α-CD11b, α-CD69, and α-CD86. Resting (G1) and activated follicular B cells (G2) were sorted. Bars and numbers show relative Il6 expression normalized to Hmbs ± SEM (n = 3) in each sorted population. (C) Time course of total cell numbers of activated and GC B cells, DCs, and macrophages in mLNs of infected mice. Numbers are means ± SEM of five mice. (D) Co-culture of WT naive CD62L+/CD4+ T cells, stimulated with α-CD3/α-CD28, and different numbers of CpG-preactivated B cells from control or IL-6–deficient mice. The left panel shows CD3/CD28-activated T cells with medium alone or with recombinant IL-6. After 4 d of co-culture, the CD4+ T cells were sorted, and Il21 mRNA expression was determined. The results are representative of three independent experiments. (A and D) Error bars represent SDs of triplicate assays. (E and F) WT, congenic Ly5.1+ B cells were injected into WT and DKO animals 2 d before influenza infection. 10 d after infection, cells from the mLNs were stained for TFH and GC B cells as described for Figs. 2 C and 1 A, respectively. Figures show fold change of each animal’s TFH or GC B cells compared with the mean percentage of TFH or GC B cells from controls within each experiment. Results are from three to six independent experiments. (E) TFH ratio comparing WT and DKO animals without or with rescue by WT Ly5.1 B cells. (F) GC B cell ratio comparing WT and DKO animals without or with rescue by WT Ly5.1 B cells. Each symbol represents an individual animal. Statistical analyses were performed using the two-sample Wilcoxon test, and all p-values are two-sided. Bars and numbers show fold change ± SEM.
Figure 4.
Figure 4.
Induction of IL-6 in activated B cells is dependent on Oct2 and OBF-1. (A and B) qPCR measurement of Il6 expression in sorted and LPS- or CpG-stimulated Gr1+, Mac1+ macrophages or BM-derived DCs from WT or Obf-1−/− mice. (C) Western blot analysis of Oct2 and OBF-1 in mature resting or CpG- or LPS-stimulated B cells. Blots were probed with α–OBF-1, α-Oct2, or α-actin. (D and E) Il6 expression in sorted and activated splenic B220+ B cells from OBF-1–deficient or WT mice and Oct+/+ or Oct−/− B cells from fetal liver reconstituted mice. Bars and numbers show relative gene expression normalized to Hmbs expression ± SEM (n = 3). (F) In vitro generation of IL-21–producing cells. Co-culture of WT naive CD4+, CD62L+ T cells, activated with α-CD3/α-CD28, with different numbers of CpG-preactivated B cells from WT, Obf-1−/−, Oct2−/−, or IL-6–deficient mice. After 4 d of co-culture, the CD4+ T cells were sorted, and Il21 expression was determined by qPCR. (A and F) Error bars represent SDs of triplicate assays. (G) T cells stimulated with medium alone, with recombinant IL-6, or with B cells and recombinant IL-6. Il21 expression was determined by qPCR and normalized as described for D–E. Bars and numbers show relative gene expression normalized to Hmbs expression ± SEM (n = 3).
Figure 5.
Figure 5.
Functional octamer factor binding sites in the Il6 locus. (A) Organization of the Il6 locus and location of the core promoter region. Positions of four consensus octamer sites identified in silico are shown. AK039125 is an adjacent gene. (B) EMSA analysis on nuclear extracts from 24-h CpG-stimulated splenic B cells, performed using short fragments (160–207 bp) containing the consensus octamer site (ATGCAAT) from an Ig heavy chain promoter or octamer sequences identified in the Il6 locus (site 1, ATTTGCAT −3302; site 2, TTTTGCAT −1438; site 3, ATTTGCAT 3793; site 4, ATTTGCAT 10615). Specific complex formation was detected through supershifts using α-Oct2 or α–OBF-1 monoclonal antibodies, as indicated. Oct2–DNA complexes are indicated with asterisks. The results are representative of three independent experiments. (C and D) Immunoprecipitation (ChIP) of chromatin from purified splenic B cells from mice of the indicated genotypes, using preimmune and hyperimmune rabbit serum specific for Oct2. (C) Cd36 is a known Oct2 target gene (König et al., 1995). (D) ChIP on the same chromatin as in C, but examining the octamer-containing Il6 gene sequences identified in A and positive by EMSA (B). Values in all graphs are means ± SEM (n = 3).
Figure 6.
Figure 6.
Loss of OBF-1 but not Oct2 results in loss of GCs and reduction of TFH during influenza infection. Analysis of GC B cells and TFH cells in control or OBF-1– or Oct2-deficient mice on day 10 of infection. (A and B) mLN cells were stained with α-B220, α-Fas, and PNA to detect GC B cells. Representative staining is shown in A, and summary of data for all mice is shown in B. (C and D) mLN cells were stained with α-CD4, α-CXCR5, and α–PD-1 to detect TFH cells. Representative staining is shown in C, and the frequency distribution for all mice is shown in D. (E) Analysis of Bcl6 and Il21 expression in CD4+, PD-1+, and CXCR5+ TFH sorted from spleens of WT and Obf-1−/− mice 10 d after influenza infection. Bars and numbers show mean normalized gene expression with ± SEM (n = 3). (F and G) TFH and GC B cells were analyzed in WT:CD19−/−, Obf-1−/−:CD19−/−, WT:TCRα−/−, and Obf-1−/−:TCRα−/− mixed BM chimeras 10 d after influenza infection. (F) Cells from the mLNs were stained for GC B cells as described in A and B. (G) Cells from the mLNs were stained for TFH cells, as described for E. Each symbol represents an individual animal. ***, P < 0.001; *, P = 0.01–0.05. Results are from three independent experiments.

References

    1. Ansel K.M., McHeyzer-Williams L.J., Ngo V.N., McHeyzer-Williams M.G., Cyster J.G. 1999. In vivo–activated CD4 T cells upregulate CXC chemokine receptor 5 and reprogram their response to lymphoid chemokines. J. Exp. Med. 190:1123–1134 10.1084/jem.190.8.1123 - DOI - PMC - PubMed
    1. Arguni E., Arima M., Tsuruoka N., Sakamoto A., Hatano M., Tokuhisa T. 2006. JunD/AP-1 and STAT3 are the major enhancer molecules for high Bcl6 expression in germinal center B cells. Int. Immunol. 18:1079–1089 10.1093/intimm/dxl041 - DOI - PubMed
    1. Baccam M., Woo S.Y., Vinson C., Bishop G.A. 2003. CD40-mediated transcriptional regulation of the IL-6 gene in B lymphocytes: involvement of NF-kappa B, AP-1, and C/EBP. J. Immunol. 170:3099–3108 - PubMed
    1. Bartholdy B., Du Roure C., Bordon A., Emslie D., Corcoran L.M., Matthias P. 2006. The Ets factor Spi-B is a direct critical target of the coactivator OBF-1. Proc. Natl. Acad. Sci. USA. 103:11665–11670 10.1073/pnas.0509430103 - DOI - PMC - PubMed
    1. Batten M., Ramamoorthi N., Kljavin N.M., Ma C.S., Cox J.H., Dengler H.S., Danilenko D.M., Caplazi P., Wong M., Fulcher D.A., et al. 2010. IL-27 supports germinal center function by enhancing IL-21 production and the function of T follicular helper cells. J. Exp. Med. 207:2895–2906 10.1084/jem.20100064 - DOI - PMC - PubMed

Publication types

MeSH terms