. 2013 Jan 15;207(2):306-18.
doi: 10.1093/infdis/jis626. Epub 2012 Oct 8.

A Syrian golden hamster model recapitulating ebola hemorrhagic fever

Affiliations

A Syrian golden hamster model recapitulating ebola hemorrhagic fever

Hideki Ebihara et al. J Infect Dis. .

Abstract

Ebola hemorrhagic fever (EHF) is a severe viral infection for which no effective treatment or vaccine is currently available. While the nonhuman primate (NHP) model is used for final evaluation of experimental vaccines and therapeutic efficacy, rodent models have been widely used in ebolavirus research because of their convenience. However, the validity of rodent models has been questioned given their low predictive value for efficacy testing of vaccines and therapeutics, a result of the inconsistent manifestation of coagulopathy seen in EHF. Here, we describe a lethal Syrian hamster model of EHF using mouse-adapted Ebola virus. Infected hamsters displayed most clinical hallmarks of EHF, including severe coagulopathy and uncontrolled host immune responses. Thus, the hamster seems to be superior to the existing rodent models, offering a better tool for understanding the critical processes in pathogenesis and providing a new model for evaluating prophylactic and postexposure interventions prior to testing in NHPs.


Figures
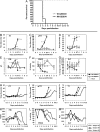
Figure 1.
Figure 1.
Virulence of mouse-adapted (MA) and wild-type (WT) Zaire ebolavirus (ZEBOV) in Syrian golden hamsters and coagulation parameters in hamsters infected with MA-ZEBOV or WT-ZEBOV and in rhesus macaques infected with ZEBOV. A, Kaplan-Meier survival curve. Groups of hamsters were inoculated intraperitoneally with 1000 focus-forming units (FFU) of MA-ZEBOV (n = 14) or WT-ZEBOV (n = 8). During the course of infection, weight loss was not apparent and hamsters maintained their weight throughout the study within 5% of baseline values (data not shown). There was no evidence of petechial rash or bleeding, both important clinical signs of Ebola hemorrhagic fever in nonhuman primates. Following infection of hamsters with 1000 FFU of either MA-ZEBOV or WT-ZEBOV, blood samples were collected and analyzed for (B) prothrombin time (PT), (C) activated partial thromboplastin time (aPTT), (D) thrombin time (TT), (E) fibrinogen concentration (FIB), (F) protein C activity (PROC), and (G) platelet count (PLT) using the STart4 instrument using the PTT Automate, STA Neoplastine CI plus, STA Thrombin, Fibri-Prest automate, and STA Staclot protein C kits, respectively (all from Diagnostica Stago) for coagulation parameters or HemaVet 950FS+ for platelet count. Changes in platelet count were indicated as percentage of change from values in mock-treated animals (100%). Solid circle/line, open square/line, and dashed line indicate values from MA-ZEBOV–infected, WT-ZEBOV–infected, and mock control hamsters, respectively. The number of animals at each time points for the infected groups ranged from 3 to 8 and for mock-infected controls from 3 to 7 (depending on the numbers of animals left at each time point). The day 5 postinfection (pi) values for hamsters infected with MA-ZEBOV also include values derived from moribund/terminal stage animals collected on day 4–4.5 pi, which is shown as 5/T on the x-axis. Graphs show the mean ± SEM for each measurement.*P < .05 and **P < .005 compared with mock-infected controls; +P < .05 and ++P < .005 compared with WT-ZEBOV–infected animals. Three healthy, filovirus-seronegative male rhesus macaques designated as subjects 1, 2, and 3, weighing 10.8 kg, 12.6 kg, and 10.4 kg, respectively, were inoculated in the caudal thigh with 1 mL of virus stock containing 1000 FFU of WT-ZEBOV. Clinical examination and sample (plasma) collections were performed daily until animals were euthanized. H, PT; I, aPTT; J, TT; K, FIB; L, PROC (y-axis describes values as percentage of normal human protein C activity); M, PLT, as described above. Open circles, solid squares, and solid triangles indicate subjects 1, 2, and 3, respectively.
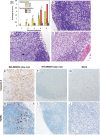
Figure 3.
Figure 3.
Pathological changes in mesenteric lymph nodes (MLNs). A, Comparison of histopathological change scores in mouse-adapted (MA) and wild-type (WT) Zaire ebolavirus (ZEBOV)–infected animals. Histopathological scores were determined and compared between MA-ZEBOV–infected (n = 6 on day 1, 2, and 3 postinfection [pi]; n = 5 on day 4 pi; n = 1 on day 5 pi) and WT-ZEBOV–infected (n = 6 at all time points) using the following scoring system: 0 = no pathological changes; 1 = minimally increased numbers of inflammatory cells; 2 = moderately increased numbers of inflammatory cells and localized cellular depletion/necrosis; 3 = severe increase in the numbers of inflammatory cells and expanded cellular depletion/necrosis with disappearance of tissue compartments. *P < .05 and **P < .005 between MA- and WT-ZEBOV–infected animals. BD, Hematoxylin-eosin staining of MLN from hamsters infected with MA-ZEBOV. B, Focal mild lymphocyte depletion was noted on day 3 pi. C, Depletion of cortical and paracortical lymphocytes, lymphadenitis, and variable lymphoblastic hyperplasia (black arrow) was noted in the infected animals on day 4 pi. D, Extensive lymphocytolysis and sinus hemorrhage were noted on day 5 pi. EJ, Detection of active caspase-3 and in situ terminal deoxynucleotidyl transferase-mediated dUTP nick-end labeling (TUNEL) staining in MLN as markers for apoptosis. Detection of active caspase-3 for (E) MA-ZEBOV–infected animals on day 4 pi. F, WT-ZEBOV–infected animals on day 4 pi. G, Mock-infected control animals. H, In situ TUNEL for MA-ZEBOV–infected animals on day 4 pi. I, WT-ZEBOV–infected animal on day 4 pi. J, Mock-infected control animals. Apoptotic cells were morphologically identified as macrophages, dendritic cells, and lymphocytes.
Figure 5.
Figure 5.
Pathological changes in liver. A, Comparison of histopathological change scores in mouse-adapted (MA) and wild-type (WT) Zaire ebolavirus (ZEBOV)–infected animals (see Figure 3 legend). BD, Hematoxylin-eosin staining of liver from hamsters infected with MA-ZEBOV. B, Focal acute hepatitis and apparent eosinophilic intracytoplasmic inclusion bodies (ICIBs) in hepatocytes were noted on day 3 postinfection (pi). The black arrow points to a hepatocyte containing ICIBs. C, Disseminated, subacute hepatitis and hemorrhages were observed in one of the hamsters on day 4 pi. D, Extensive hepatocellular necrosis with hemorrhage, acute inflammation, and numerous ICIBs was observed in terminal animals on day 5 pi. EG, Detection of active caspase-3 as a marker for apoptosis. E, Multiple active caspase-3 positive Kupffer cells were noted on day 4 pi. F, A minimal number of caspase-3–positive cells, mainly Kupffer cells, were detected in WT-ZEBOV–infected animals on day 4 pi. G, Caspase-3 was detected in a limited number of Kupffer cells in mock-infected control. HJ, In situ TUNEL for detection of apoptosis. H, Extensive TUNEL staining in Kupffer cells and hepatocytes was detected in MA-ZEBOV–infected animals on day 4 pi. I, A limited number of TUNEL-positive cells were observed in WT-ZEBOV–infected animals on day 4 pi. J, A limited number of TUNEL-positive cells were also detected in mock-infected control animals.
Figure 7.
Figure 7.
Type I interferon responses in hamsters infected with mouse-adapted (MA) or wild-type (WT) Zaire ebolavirus (ZEBOV). STAT1, Mx2, and PKR gene expression in mesenteric lymph node (MLN), spleen, liver, and blood. Solid circle/line, open square/line, and dashed lines indicate values for MA-ZEBOV–infected, WT-ZEBOV–infected, and mock control hamsters, respectively. Data are indicated as the relative fold increase between the infected/treated and mock treated hamsters. The CT value for each test gene in both infected and mock treated hamsters was first normalized to the β-actin and ribosomal protein L18 (RPL18) CT (ΔCT) and then compared to the averaged normalized CT value from all mock-treated (calibrator) hamsters to determine the ΔΔCT. The final value is displayed as the relative fold increase between the infected and mock treated hamsters and plotted on the graph. The number of animals for these assays was 3 at each time point. All values on day 5 postinfection (pi) from hamsters infected with MA-ZEBOV also include values derived from moribund/terminal stage animals on day 4–4.5 pi, which is shown as 5/T on the x-axis. Graphs show the mean ± SEM for each measurement. *P < .05 and **P < .005 from mock-infected controls; +P < .05 and ++P < .005 from WT-ZEBOV–infected animals.
Figure 2.
Figure 2.
Growth characteristics of mouse-adapted (MA) and wild-type (WT) Zaire ebolavirus (ZEBOV) in hamsters. On days 1, 2, 3, 4, and 5 postinfection (pi), selected organs were collected from 3 infected animals per group, with the exception of the day 5 pi sample for MA-ZEBOV–infected animals where n = 1 due to the progression of infection. Virus infectivity titers in (A) spleen, (B) liver, (C) blood, and (D) kidney, heart, lung, and brain were determined in Vero E6 cells using a focus-forming assay. Virus titers of WT-ZEBOV in lung, heart, and brain were under the detection limit (50 focus-forming units (FFU)/mL or gram) of the focus-forming assay used for the titration. Solid circle/line and open square/line indicate values from MA-ZEBOV–infected and WT-ZEBOV–infected hamsters, respectively. Graphs show the mean ± SEM for each measurement. Viral antigen was detected using a rabbit polyclonal anti-VP40 antibody. Level of viral replication in tested organs (including viremia levels) in MA-ZEBOV–infected hamsters were comparable to the titers obtained in ZEBOV nonhuman primate models [3, 4]. The presence of viral antigen in MA-ZEBOV– and WT-ZEBOV–infected hamsters was compared among (E) mesenteric lymph nodes (MLNs), (F) spleen, (G) liver, and (H) adrenal gland. E, Major target cells in the MLN of MA-ZEBOV–infected hamsters (on day 3 pi). Macrophages (histiocytes) as well as dendritic cell (DC)–like cells were mainly positive for viral antigens. F, Major target cells in the spleen of MA-ZEBOV–infected hamsters (on day 3 pi). Viral antigens were mainly detected in macrophages in the red pulp. In the marginal zone, antigen-positive macrophages and marginal reticular-like cells (MRCs) were detected. In the white pulp zone, DC-like cells and MRCs were positive for viral antigens, whereas no antigen was detected in lymphocytes mainly consisting of T cells and B cells (in the B-cell follicle). G, Major target cells in the liver of MA-ZEBOV–infected animals (on day 3 pi). Kupffer cells were mainly positive for viral antigens at early stage of infection, while infection was expanded to include hepatocytes at later stages of infection. H, Antigen detection in the adrenal glands of hamsters infected with MA-ZEBOV (day 5 pi). In MA-ZEBOV–infected animals, viral antigens were detected at regions of the cortex (including zona glomerulosa and zona fasciculata) and medulla (containing chromaffin cells). There were only a limited number of antigen-positive cells detected in the adrenal glands of WT-ZEBOV–infected animals (data not shown).
Figure 4.
Figure 4.
Pathological changes in spleen. A, Comparison of histopathological change scores in mouse-adapted (MA) and wild-type (WT) Zaire ebolavirus (ZEBOV)–infected animals (see Figure 3 legend). BD, Hematoxylin-eosin staining of spleen from hamsters infected with MA-ZEBOV. B, Mild lymphocyte depletion in the white pulp was noted on day 3 postinfection (pi) (black arrows). C, Diffuse necrosis associated with lymphocyte depletion was observed on day 4 pi. D, Extensive and severe diffuse necrosis/depletion of all types of cells associated with the destruction of tissue architecture (disappearance of tissue compartments recognized as the red pulp, white pulp, and marginal zone) was noted on day 5 pi. EJ, Similar to results in the mesenteric lymph node, MA-ZEBOV induced more apoptosis in infected animals than WT-ZEBOV. EG, Detection of active caspase-3 as marker for apoptosis. E, MA-ZEBOV–infected animals on day 4 pi. F, WT-ZEBOV–infected animals on day 4 pi. G, Mock-infected control animals. HJ, In situ TUNEL for detection of apoptosis. H, MA-ZEBOV–infected animals on day 4 pi. I, WT-ZEBOV–infected animals on day 4 pi. J, Mock-infected control animals. Apoptotic cells were identified as macrophages, dendritic cells, and lymphocytes based on some retention of cell morphology.
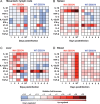
Figure 6.
Figure 6.
Cytokine and chemokine gene expression profiles in hamsters infected with mouse-adapted (MA) or wild-type (WT) Zaire ebolavirus (ZEBOV). A, Mesenteric lymph node (MLN). B, Spleen. C, Liver. D, Blood. Heat maps demonstrate the average responses with respect to gene induction as a fold increase over uninfected controls. Values for day 5 postinfection (pi) from hamsters infected with MA-ZEBOV also include values derived from moribund/terminal stage animals on day 4–4.5 pi, which are shown as 5/T days pi. The number of animals for these assays was 3–8 for MA-ZEBOV infection and 2–6 for WT-ZEBOV and was dependent on the availability of animals at each time point. The number of mock-infected animals for the assay was 3–7. The data were analyzed using the ΔΔCT method [19]. The final value is displayed as the relative fold increase between the infected and mock-treated hamsters. To assure the accuracy of the assay, we chose 2 housekeeping genes, β-actin and ribosomal protein L18 (RPL18), and compared the results. There was no apparent difference in the results of assay runs using either β-actin or RPL18 as the housekeeping gene, and the data presented in the figure were calculated relative to β-actin.

References

    1. Sanchez A, Geisbert T, Feldmann H. Filoviridae: Marburg and Ebola viruses. In: Knipe D, Howley P, editors. Fields virology. 5th ed. Philadelphia: Lippincott Williams & Wilkins; 2006. pp. 1409–48.
    1. Bente D, Gren J, Strong JE, Feldmann H. Disease modeling for Ebola and Marburg viruses. Dis Model Mech. 2009;2:12–7. - PMC - PubMed
    1. Ebihara H, Rockx B, Marzi A, et al. Host response dynamics following lethal infection of rhesus macaques with Zaire ebolavirus. J Infect Dis. 2011;204(Suppl 3):S991–9. - PMC - PubMed
    1. Geisbert TW, Hensley LE, Larsen T, et al. Pathogenesis of Ebola hemorrhagic fever in cynomolgus macaques: evidence that dendritic cells are early and sustained targets of infection. Am J Pathol. 2003;163:2347–70. - PMC - PubMed
    1. Geisbert TW, Young HA, Jahrling PB, Davis KJ, Kagan E, Hensley LE. Mechanisms underlying coagulation abnormalities in Ebola hemorrhagic fever: overexpression of tissue factor in primate monocytes/macrophages is a key event. J Infect Dis. 2003;188:1618–29. - PubMed

Publication types