. 2012 Oct 23;109(43):17507-12.
doi: 10.1073/pnas.1111941109. Epub 2012 Oct 8.

The chromatin insulator CTCF and the emergence of metazoan diversity

Affiliations

The chromatin insulator CTCF and the emergence of metazoan diversity

Peter Heger et al. Proc Natl Acad Sci U S A. .

Abstract

The great majority of metazoans belong to bilaterian phyla. They diversified during a short interval in Earth's history known as the Cambrian explosion, ~540 million years ago. However, the genetic basis of these events is poorly understood. Here we argue that the vertebrate genome organizer CTCF (CCCTC-binding factor) played an important role for the evolution of bilaterian animals. We provide evidence that the CTCF protein and a genome-wide abundance of CTCF-specific binding motifs are unique to bilaterian phyla, but absent in other eukaryotes. We demonstrate that CTCF-binding sites within vertebrate and Drosophila Hox gene clusters have been maintained for several hundred million years, suggesting an ancient origin of the previously known interaction between Hox gene regulation and CTCF. In addition, a close correlation between the presence of CTCF and Hox gene clusters throughout the animal kingdom suggests conservation of the Hox-CTCF link across the Bilateria. On the basis of these findings, we propose the existence of a Hox-CTCF kernel as principal organizer of bilaterian body plans. Such a kernel could explain (i) the formation of Hox clusters in Bilateria, (ii) the diversity of bilaterian body plans, and (iii) the uniqueness and time of onset of the Cambrian explosion.


Conflict of interest statement

The authors declare no conflict of interest.

Figures
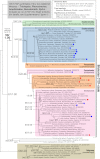
Fig. 1.
Fig. 1.
Existence of a bilaterian CTCF clade. Phylogenetic analysis is shown of 162 CTCF candidates from Bilateria and early branching metazoans. CTCFs form a distinct, highly supported cluster. All major groups of Nephrozoa are represented within this cluster whereas candidates from early branching metazoans are not. Results of the latter are omitted for clarity (see SI Appendix, Fig. S1 for the complete tree). Blue dots indicate previously published CTCF orthologs, and red dots highlight orthologs we annotated from genomic contigs. Branch labels indicate origin and accession number of a sequence.
Fig. 2.
Fig. 2.
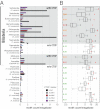
Enrichment of CTCF-binding sites in bilaterian genomes. (A) Relative abundance of predicted CTCF-binding sites in 18 different genomes (determined by PATSER). Black bars represent the number of binding sites resulting from the intact CTCF matrix. Colored bars indicate the results of four corrupted matrices that differ from the original matrix by a reciprocal nucleotide exchange at two conserved positions (SI Appendix, Fig. S5). The affiliation of an organism to the Bilateria (parentheses) and the distribution of CTCF (gray background) are indicated. Black arrowhead: no enrichment of CTCF sites in T. spiralis despite the presence of CTCF. Estimated specificity of binding-site prediction: >82% (SI Appendix, Table S2). (B) Significance of binding-site enrichment. Box plots show the relative distribution of motif counts in 18 genomes based on 100 randomized versions of the CTCF matrix. The number of hits based on the intact matrix is shown as a red diamond for each species. P values are indicated at the left (red, P ≤ 0.01; orange, P = 0.01–0.05; green, P ≥ 0.05). Whiskers extend to the most extreme data point, which is 1.5 times the interquartile range (indicated by the box) away from the box. Outliers are omitted for clarity. Differences in the motif count per megabase between Fig. 2A and 2B are caused by differences in the applied experimental procedures.
Fig. 3.
Fig. 3.
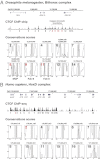
Conservation of CTCF-binding sites in Hox clusters within Drosophilids and vertebrates. (A) (Top) Schematic view of the D. melanogaster Bithorax Hox complex with the Hox genes Ubx, Abd-A, and Abd-B (blue), drawn to scale. (Middle) Position of 14 CTCF ChIP-chip signals relative to the D. melanogaster BX-C (data from ref. 43). The known boundary elements MCP, Fab-6, Fab-7, and Fab-8 are highlighted in red (sites 8–11). (Bottom) Conservation of 10 ChIP-positive CTCF sites in 12 Drosophila species. Each plot shows the PHASTCONS score of the site(s) indicated on top, ±50 bp. It represents the conservation profile of a ChIP-positive target-site prediction. The 15-bp target sequence is highlighted as a gray box. All CTCF sites except no. 12 are positioned within a local conservation maximum. (B) (Top) Schematic view of the human HoxD complex with Hox genes d13d1 (blue), drawn to scale. (Middle) Position of 18 CTCF ChIP-seq signals relative to the human HoxD cluster (as in ref. 55). Site 2 (red) is a verified binding site within a previously identified chromatin boundary (59). (Bottom) Conservation of 12 ChIP-positive CTCF sites in mammals. All sites except no. 16 are positioned within local conservation maxima.
Fig. 4.
Fig. 4.
Correlation between CTCF and Hox gene clustering in Metazoa. Shown is the presence of CTCF and Hox gene clusters in animal phyla, mapped onto a phylogenetic tree. Only phyla for which information is available are shown. Plus and minus symbols indicate the presence or absence of CTCF and/or Hox clusters. Open circles indicate presence or absence is not known. Gray background: positive correlation between CTCF state and Hox gene clustering. 1, inferred from the absence in 51,000 ESTs; 2, SI Appendix, Fig. S10; 3, presence of CTCF in basal nematodes and absence in C. elegans and other derived nematodes (22). References for the state of Hox gene clustering are in SI Appendix, Table S3.

References

    1. Canfield DE, Poulton SW, Narbonne GM. Late-Neoproterozoic deep-ocean oxygenation and the rise of animal life. Science. 2007;315:92–95. - PubMed
    1. Conway Morris S. Darwin’s dilemma: The realities of the Cambrian ‘explosion’. Philos Trans R Soc Lond B Biol Sci. 2006;361:1069–1083. - PMC - PubMed
    1. Marshall CR. Explaining the Cambrian “explosion” of animals. Annu Rev Earth Planet Sci. 2006;34:355–384.
    1. Budd GE. The earliest fossil record of the animals and its significance. Philos Trans R Soc Lond B Biol Sci. 2008;363:1425–1434. - PMC - PubMed
    1. Putnam NH, et al. Sea anemone genome reveals ancestral eumetazoan gene repertoire and genomic organization. Science. 2007;317:86–94. - PubMed

Publication types

LinkOut - more resources