. 2012 Oct 23;109(43):17687-92.
doi: 10.1073/pnas.1209918109. Epub 2012 Oct 8.

Grid cell firing patterns signal environmental novelty by expansion

Affiliations

Grid cell firing patterns signal environmental novelty by expansion

Caswell Barry et al. Proc Natl Acad Sci U S A. .

Abstract

The hippocampal formation plays key roles in representing an animal's location and in detecting environmental novelty to create or update those representations. However, the mechanisms behind this latter function are unclear. Here, we show that environmental novelty causes the spatial firing patterns of grid cells to expand in scale and reduce in regularity, reverting to their familiar scale as the environment becomes familiar. Simultaneously recorded place cell firing fields remapped and showed a smaller, temporary expansion. Grid expansion provides a potential mechanism for novelty signaling and may enhance the formation of new hippocampal representations, whereas the subsequent slow reduction in scale provides a potential familiarity signal.


Conflict of interest statement

The authors declare no conflict of interest.

Figures

Fig. 1.
Fig. 1.
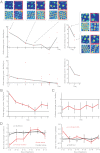
Grid cell firing patterns expand and become less regular in novel arenas. On the first day of the protocol, trials 1 (Left) and 5 (Right) were performed in a familiar arena and trials 2–4 were performed in a novel arena (red outline and text). (A) Three grid cells (iiii, from different animals) show raw data plots [Top; locations of action potentials (green) on the animal’s path (black)], firing rate maps [Middle; high firing rate (red),low rate (blue), unvisited locations (white), and peak rate (shown above map)], and spatial autocorrelograms (Bottom; black crosses show the central peak and six surrounding peaks used to define the grid scale and gridness values (shown above the plot)]. (B) All grid cells recorded on day 1 in the novel arena (n = 22). (i) Grid scale increases in the novel arena (trial 2) and decreases during the subsequent 40 min (trials 3 and 4). Grids return to their original scale in the familiar arena (trial 5; red bars show mean grid scale). (ii) Gridness decreases in the novel arena. (C) (i) Movement of animals between the familiar and novel arenas (trial 1 vs. trial 2) caused grids to rotate (Left) and shift (Right). (ii) Similar comparison between visits to the familiar arena (trial 1 vs. trial 5) indicated that grids maintained the same orientation (Left) and offset (Right). In all figures, error bars show SEM. *P < 0.05; **P < 0.01; ***P < 0.001 for two-tailed t tests.
Fig. 2.
Fig. 2.
Novelty-driven grid expansion and irregularity attenuate with experience over days. (A) Data from four animals [r1635 (Upper Left), r1549 (Upper Right), r1625(Lower Left), and r1604 (Lower Right)] show the difference between novel and familiar grid scales by day (r1635, n = 14 cell days; r1549, n = 4 cell days; r1625, n = 18 cell days; r1604, n = 3 cell days; gray line, median change in scale between familiar and novel trials; red circles, data points for individual cells). Arrows indicate rate maps and autocorrelograms for a specific cell recorded over multiple days; in each case, the first rate map corresponds to trial 1 (the first familiar trial of the day) and the second corresponds to trial 2 (the first novel trial of the day; red outline). r1549 and r1604 recordings were truncated after cells were lost. The mean change in grid scale (B) and gridness (C) between novel and familiar arenas is shown by day. Data shown are the mean over rats from all 34 recording sessions (103 cell days). (D) Change in grid scale (Left) and gridness (Right) for cells recorded on adjacent days for the novel (red) and familiar (black) arenas. The day-to-day reduction in the grid scale in the novel arena attenuates over days, whereas the increase in gridness is focused on days 1–2. Data points show the mean over cells (n = 52 cell days), error bars indicate SEM, and Spearman’s ρ and the associated P value show the correlation between day-to-day change and days of experience.
Fig. 3.
Fig. 3.
Grid expansion and irregularity are accompanied by complete remapping of CA1 place cells. (A) Firing rate maps for two grid cells and four place cells simultaneously recorded on the first day of the protocol (novel trials outlined in red, data from r1838). (B) Moving from the familiar arena to the first trial in the novel arena caused large changes in CA1 place cells’ firing location (Left, spatial correlation between firing rate maps; correlations were calculated for four 90° rotations of the novel arena relative to familiar arena, and the highest values were reported) and firing rates (Middle, absolute difference in mean rate divided by the sum of mean rates), compared with the two familiar trials. (Right) Both place field size and grid scale increase during the first novel trial and decrease over subsequent novel trials [red line, percentage increase in place field diameter, defined as square root of increase in field area divided by π, in novel (n = 40) vs. familiar (n = 47) arenas; black line, percentage increase in grid scale from concurrently recorded grid cells (n = 16); and gray dashed line, percentage change in grid field diameter, for comparison]. In all figures, error bars show SEM. *P < 0.05; **P < 0.01; ***P < 0.001 for two sample t tests.

References

    1. Hafting T, Fyhn M, Molden S, Moser MB, Moser EI. Microstructure of a spatial map in the entorhinal cortex. Nature. 2005;436:801–806. - PubMed
    1. Barry C, Hayman R, Burgess N, Jeffery KJ. Experience-dependent rescaling of entorhinal grids. Nat Neurosci. 2007;10:682–684. - PubMed
    1. Fyhn M, Hafting T, Treves A, Moser MB, Moser EI. Hippocampal remapping and grid realignment in entorhinal cortex. Nature. 2007;446:190–194. - PubMed
    1. Sargolini F, et al. Conjunctive representation of position, direction, and velocity in entorhinal cortex. Science. 2006;312:758–762. - PubMed
    1. Fiete IR, Burak Y, Brookings T. What grid cells convey about rat location. J Neurosci. 2008;28:6858–6871. - PMC - PubMed

Publication types

LinkOut - more resources