Review
. 2012 Nov;250(1):317-34.
doi: 10.1111/imr.12001.

Structural and dynamic determinants of type I interferon receptor assembly and their functional interpretation

Affiliations
Review

Structural and dynamic determinants of type I interferon receptor assembly and their functional interpretation

Jacob Piehler et al. Immunol Rev. 2012 Nov.

Abstract

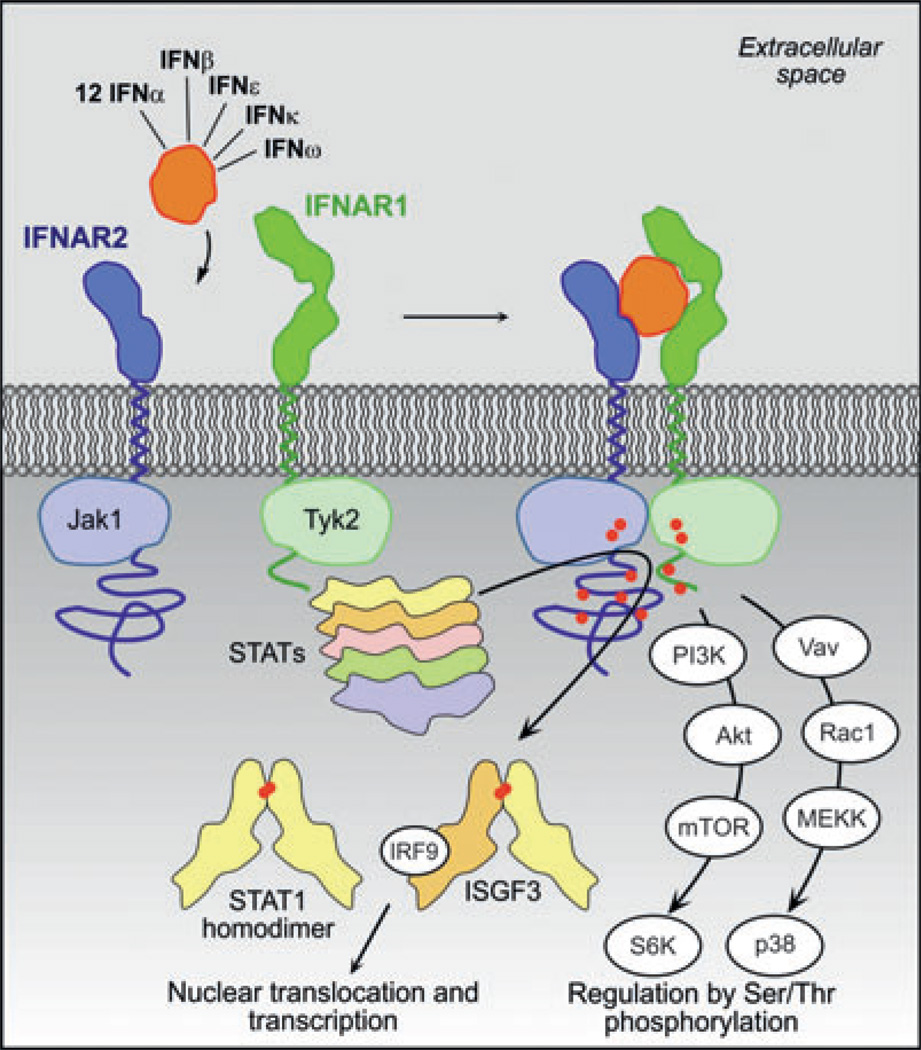
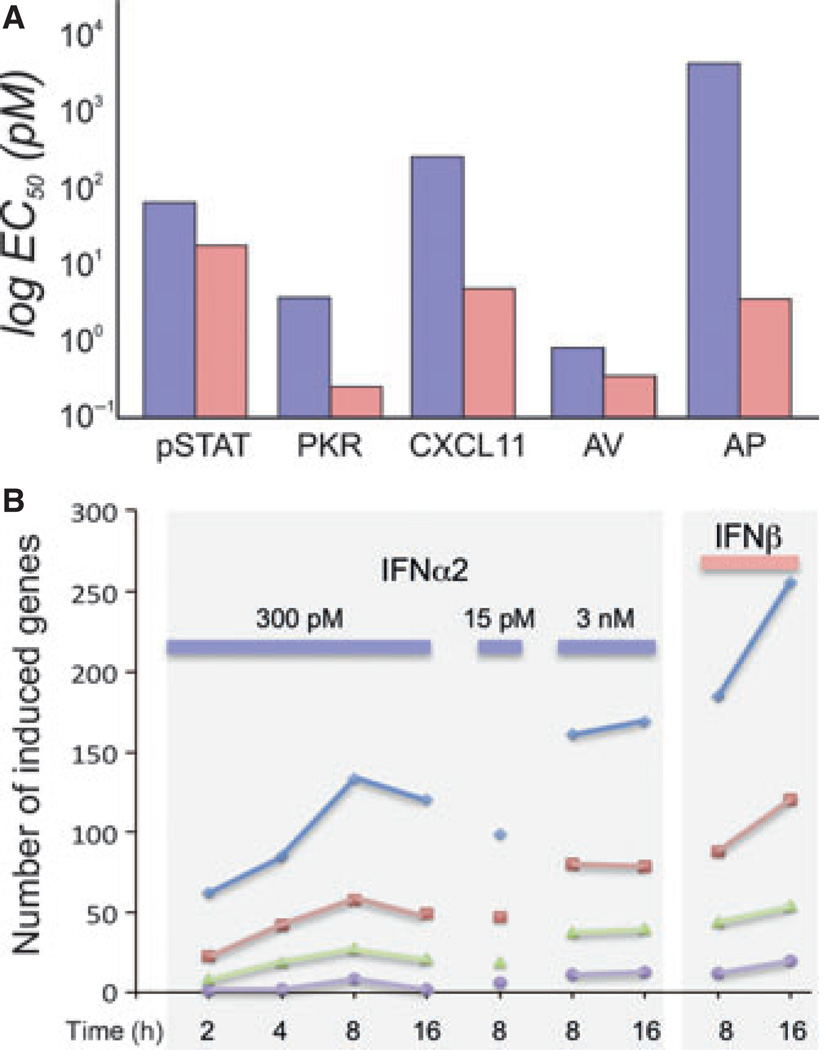
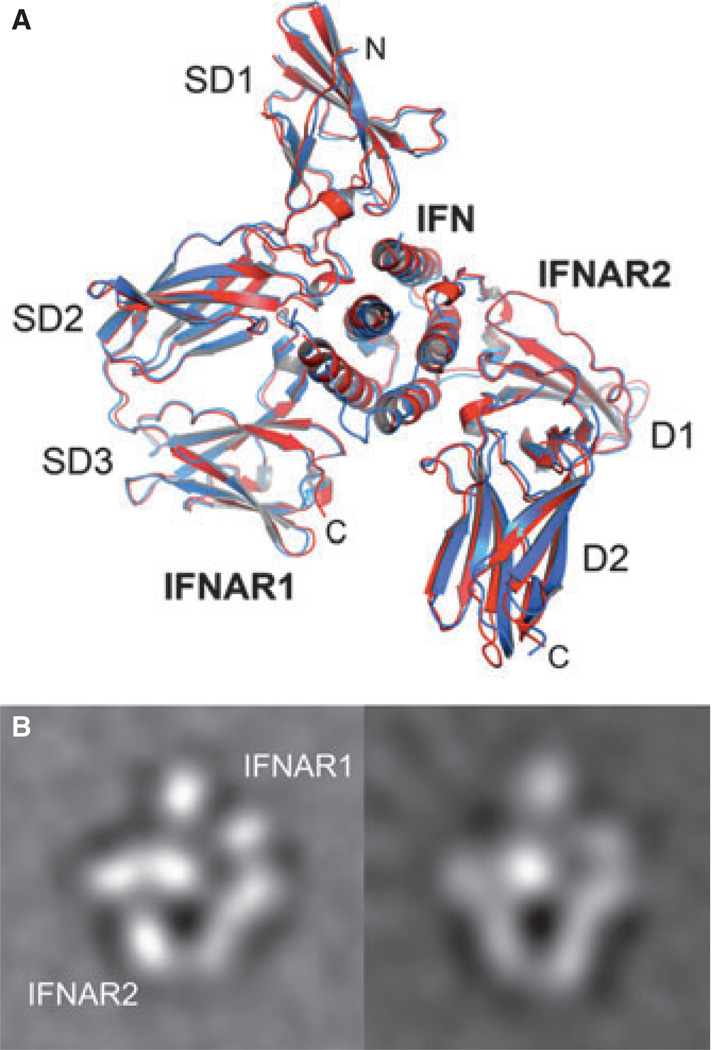
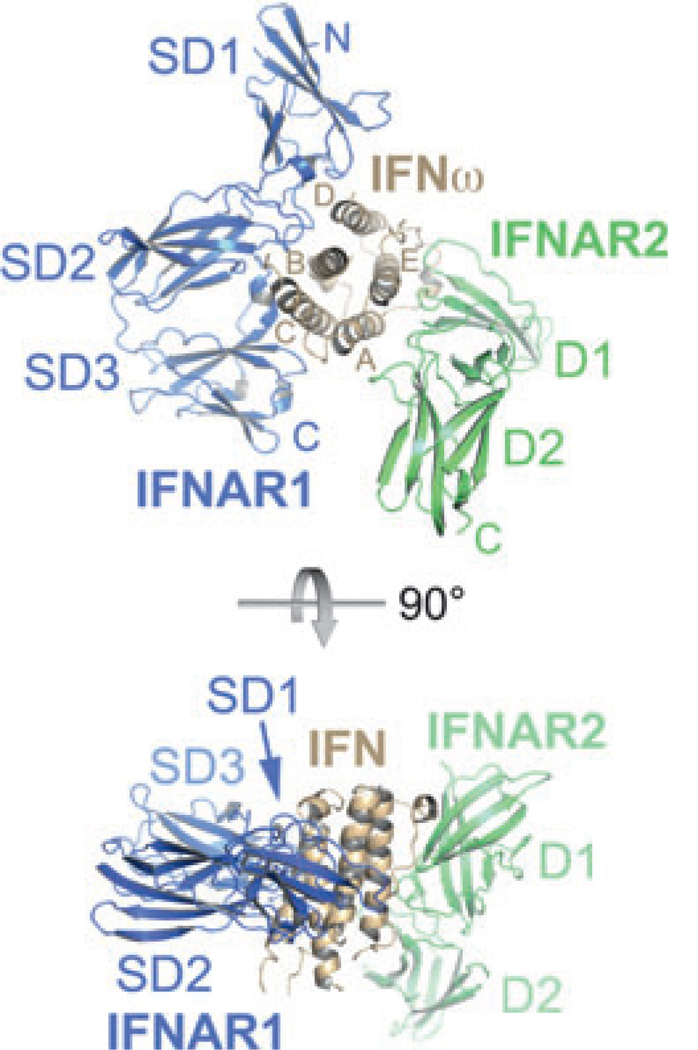
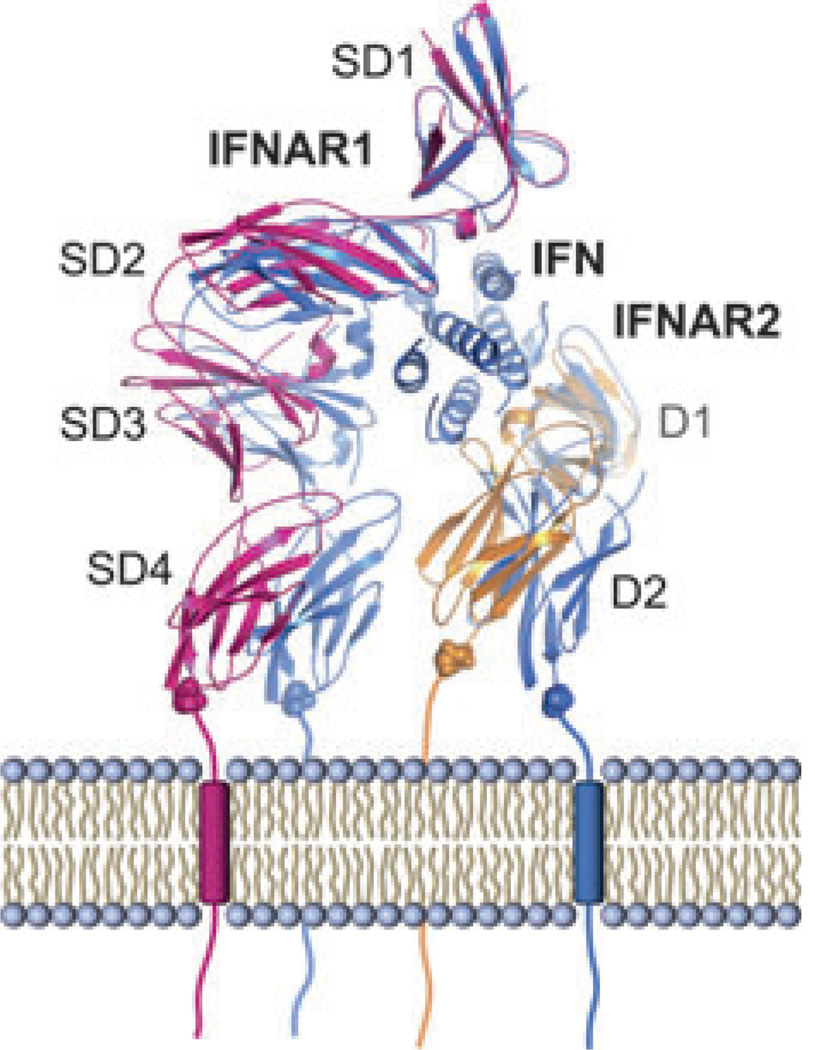
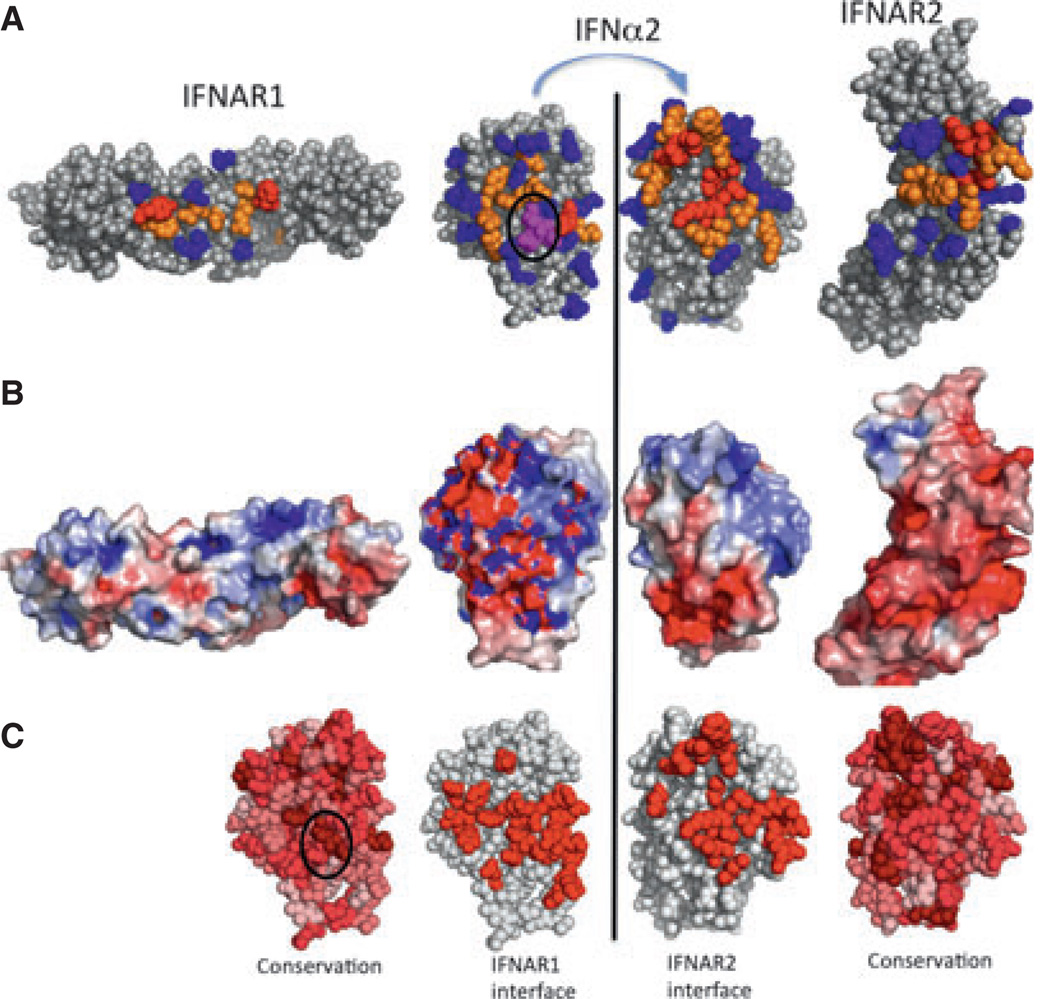
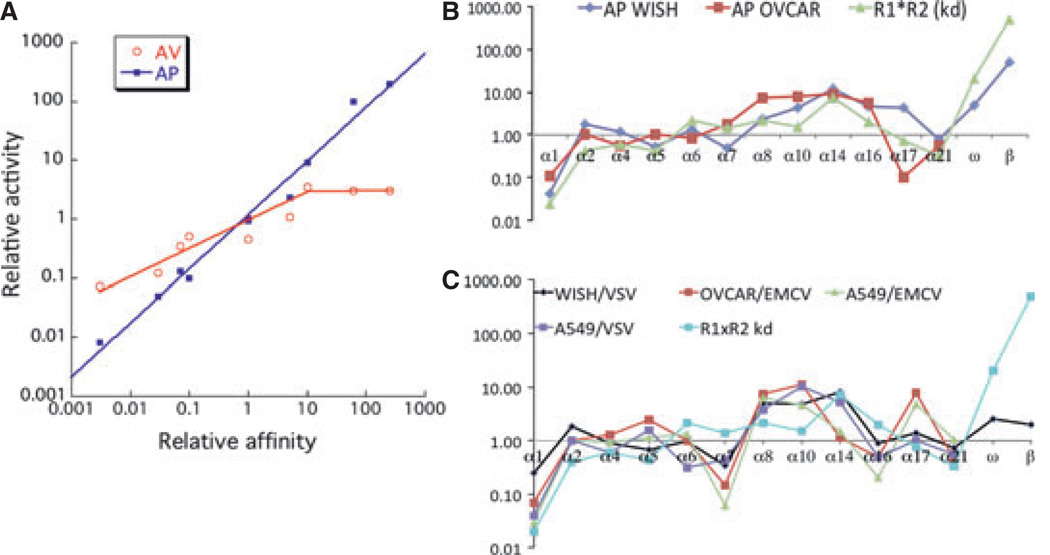
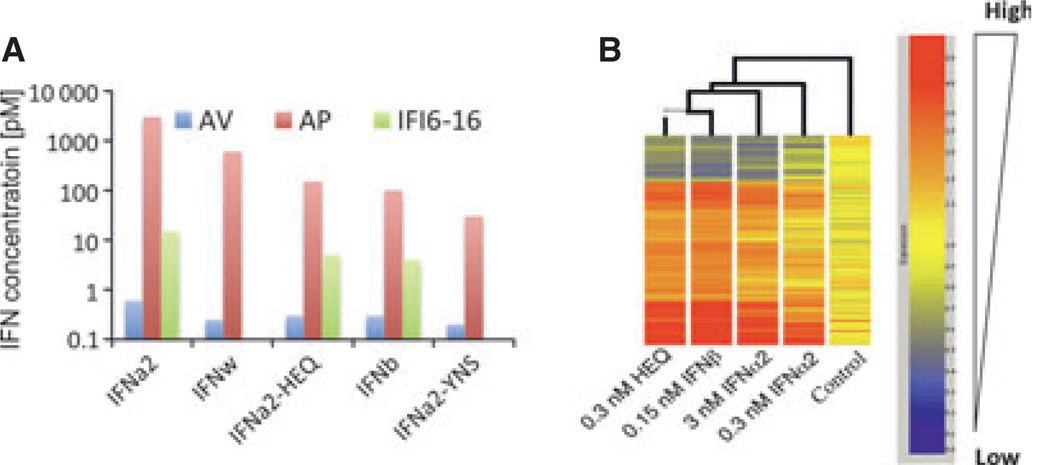
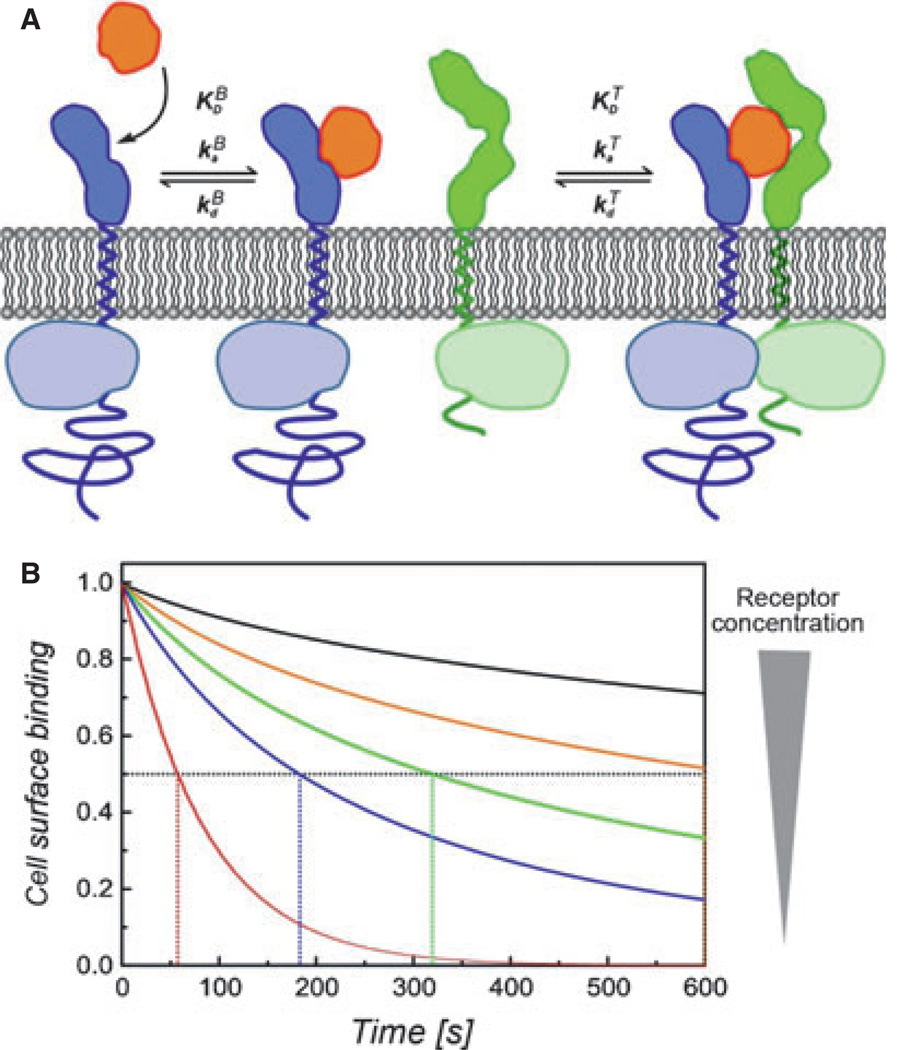
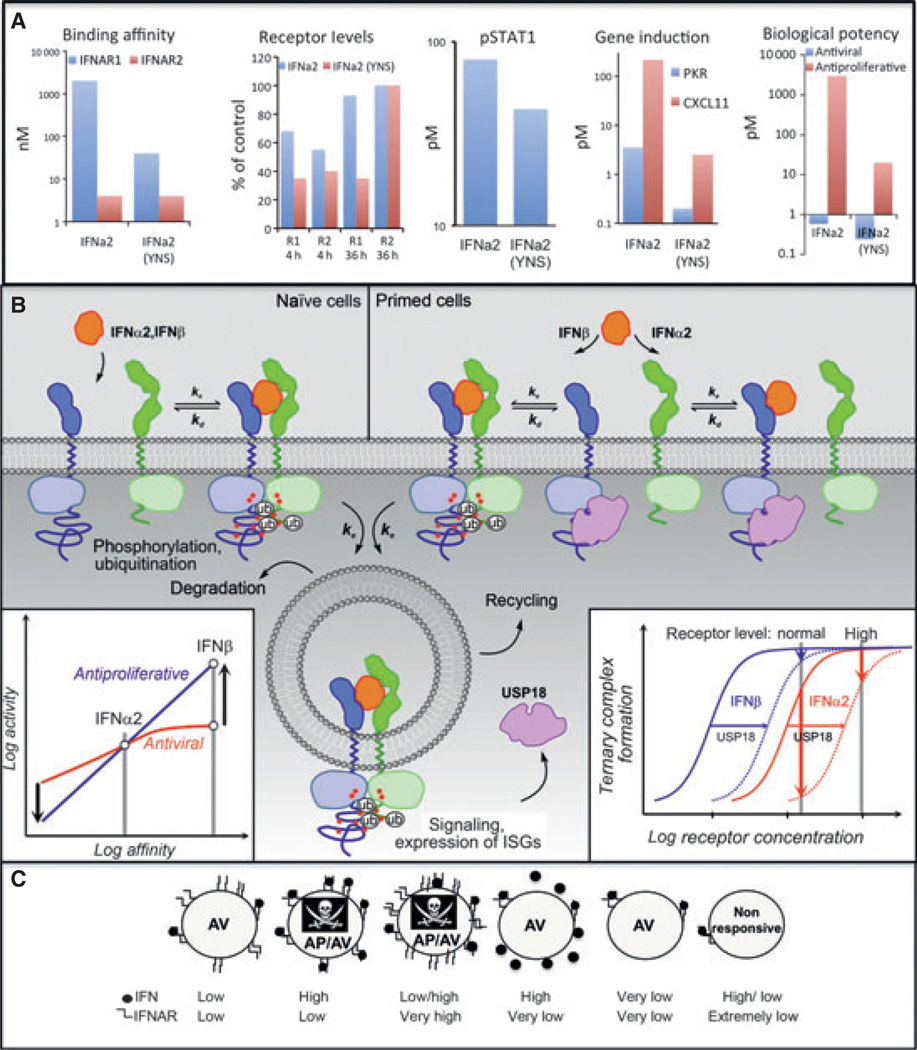
Type I interferons (IFNs) form a network of homologous cytokines that bind to a shared, heterodimeric cell surface receptor and engage signaling pathways that activate innate and adaptive immune responses. The ability of IFNs to mediate differential responses through the same cell surface receptor has been subject of a controversial debate and has important medical implications. During the past decade, a comprehensive insight into the structure, energetics, and dynamics of IFN recognition by its two-receptor subunits, as well as detailed correlations with their functional properties on the level of signal activation, gene expression, and biological responses were obtained. All type I IFNs bind the two-receptor subunits at the same sites and form structurally very similar ternary complexes. Differential IFN activities were found to be determined by different lifetimes and ligand affinities toward the receptor subunits, which dictate assembly and dynamics of the signaling complex in the plasma membrane. We present a simple model, which explains differential IFN activities based on rapid endocytosis of signaling complexes and negative feedback mechanisms interfering with ternary complex assembly. More insight into signaling pathways as well as endosomal signaling and trafficking will be required for a comprehensive understanding, which will eventually lead to therapeutic applications of IFNs with increased efficacy.


Conflict of interest statement

The authors have no conflicts of interest to declare.

Figures

Fig. 1
Fig. 1. The type I interferon (IFN) signaling network
By simultaneous interaction of IFNs with the two-receptor subunits IFNAR1 and IFNAR2, the active signaling complex is formed. Subsequently, the tyrosine kinase 2 (Tyk2) and Janus family kinases (Jak1) associated with IFNAR1 and IFNAR2, respectively, transphosphorylate each other, and phosphorylate-specific tyrosine residues of IFNAR1 and IFNAR2 (indicated as red dots). These serve as docking sites for effector proteins of the signal transducers and activators of transcription (STAT) family. Upon phosphorylation, STAT1 and STAT2 form homo- and heterodimers, which translocate into the nucleus to activate transcription.
Fig. 2
Fig. 2. Differential activities of interferon α 2 (IFNα2) and interferon β (IFNβ) in WISH cells
(A) Comparison of the potencies of IFNα2 (blue) and IFNβ (pink) in signal transducers and activators of transcription (STAT) phosphorylation (pSTAT), gene expression [protein kinase R (PKR) and CXCL11], as wells as antiviral (AV) and antiproliferative (AP) activity. (B) Gene induction after activation at different concentrations and times (levels of gene induction: blue, >2-fold; red, >3-fold; green, >5-fold; violet, >10-fold).
Fig. 3
Fig. 3. Architectures of the ternary complex observed for different interferons (IFNs)
(A) Overlay of the X-ray structures of IFNα2 (red) and IFNω (blue) in complex with IFNAR1 and IFNAR2. (B) Averaged single particle electron microscopy (EM) images of the ternary complex with IFNα2 (left) and IFNβ (right).
Fig. 4
Fig. 4. X-ray structure of IFNω (brown) in complex with IFNAR1-ectodomain (ECD; blue) and IFNAR2-ECD (green)
The helices of IFNω are labeled with the letters (A–E). The FNIII-like domains of IFNAR1 (SD) and IFNAR2 (D) are numbered starting from the N-terminus.
Fig. 5
Fig. 5. Ligand-induced conformational changes in IFNAR (based on a comparison of unbound and bound structures)
The bound conformation is in blue. SD4 of IFNAR1 was not visible in the X-ray structures and was modeled for clarity.
Fig. 6
Fig. 6. Functional characterization of the interferon–receptor complex
Interferon alpha 2 (IFNα2) is pictured with its IFNAR1 binding site (left) and IFNAR2 binding site (right). (A) Changes in affinity upon mutation: red, >10-fold reduction; orange, 2- to 10-fold reduction; blue, no change; magenta, increase in binding affinity upon mutation. (B) Electrostatic potential of the proteins. (C) Residue conservation between IFNα2, IFNα8, IFNβ, and IFNω and the location of IFN interfaces. The shading from dark to light red marks the degree of conservation, with residues colored dark red being conserved in all four IFNs (note that these are the minority, even in the binding site). The circle marks the location of the HEQ residues [colored in magenta in (A)].
Fig. 7
Fig. 7. Sequence alignment of several interferons (IFNs)
(A) Colored in gray–blue is the IFNAR1 binding site, and in pink the IFNAR2 binding site. The consensus relates to all IFNs, and not just to the four subtypes displayed. Binding relates to change in binding affinity upon mutation. Two dots are for hotspots (over 10-fold change upon mutation). ^denotes mutations to Ala that result in increase in binding. (B) Overlay of the binding site between IFN (numbers in black) and IFNAR1 (numbers in red) of the site of the YNS tight-binding mutation (green) and the consensus HEQ sequence (cyan). (C) The binding site between R33 of IFNα2 (numbered in black) and IFNAR2 (residues in cyan, numbers in red). Side-chain to main-chain hydrogen bonds are marked by arrows.
Fig. 8
Fig. 8. Correlation with affinities and activities of interferon (IFN) subtypes and mutants
(A) Antiviral (AV) and antiproliferative (AP) potencies of IFNα2 mutants as a function of the product of the binding affinities toward IFNAR1 and IFNAR2. All the values are relative to those determined for IFNα2. (B) Antiproliferative activities and (C) antiviral protection of all IFNα subtypes as well as IFNβ and IFNω in different cell lines (WISH, OVCAR, and A549) in comparison to the product of the binding affinity (R1 × R2). The viruses used were vesicular stomatitis virus (VSV) and encephalomyocarditis virus (EMCV).
Fig. 9
Fig. 9. Similar and differential activities by type I interferons
(A) EC50 values of activation of the antiviral and antiproliferative responses and of IFI6–16 gene induction. (B) Gene induction after different treatments with interferons as determined by gene array.
Fig. 10
Fig. 10. Receptor assembly and dynamics in the plasma membrane
(A) Two-step assembly of the ternary interferon(IFN)–receptor complex in the plasma membrane (orange, IFN; blue, IFNAR2; green, IFNAR1): rapid and high-affinity binding of IFN to IFNAR2 is followed by recruitment of IFNAR1 into the ternary complex. The dynamic equilibrium between binary and ternary complexes depends on the 2D dissociation constant KDT and 2D concentrations of the receptor subunits. (B) Implications of this mechanism for ligand-binding affinity and kinetics: normalized ligand dissociation kinetics at different cell surface concentrations of the receptor subunits compared with the dissociation from IFNAR2 only (red curve). The half-life of IFN binding to the cell surface receptor (indicated by dotted lines) increases with increasing receptor concentrations. The orange curve approximately corresponds to the affinity observed in cell surface binding experiments.
Fig. 11
Fig. 11. A basic model to explain differential activity of interferon (IFN), i.e. diverging affinity–activity relationships for different cellular responses
(A) The bar-graphs show similarities and differences in response to IFNα2 and the tight binding variant IFNα2-YNS. (B) Shows a model that explains how differential activation (highlighted by the arrows in the bottom-left inset) can be rationalized. In naïve cells (left), reversible IFN binding and ternary complex formation is followed by endocytosis of the signaling complex. If the rate constant of endocytosis ke significantly exceeds the rate constant of complex dissociation kd, ternary complex formation can be considered irreversible, independent on the IFN binding affinity. While signaling probably proceeds in early endosomes, endocytosis also leads to receptor degradation. Thus, similar activities for IFNα2 and IFNβ are observed in naïve cells. Cells activated with IFNs over extended time periods (primed cells) express the negative feedback regulator USP18, which interferes with ternary complex formation by interacting membrane proximal with the intracellular region of IFNAR. Owing to the lower affinity of IFNα2 toward IFNAR1, a further reduction by USP18 drastically reduces ternary complex formation for this ligand at the typically low receptor surface concentrations (bottom-left inset). Thus, signaling by IFNα2 is abrogated, while this effect is overcome by the much higher affinity of IFNβ toward IFNAR1 and IFNAR2. At increased receptor levels, only minor desensitization is observed. (C) Low occupancy of few receptors is sufficient to initiate an antiviral state, whereas only high occupancy of many receptors will initiate the antiproliferative response. Therefore, cells with reduced receptor numbers will not initiate an antiproliferative response, whereas cells with increased receptor numbers will induce an antiproliferative response even at lower IFN concentration.

References

    1. Stetson DB, Medzhitov R. Type I interferons in host defense. Immunity. 2006;25:373–381. - PubMed
    1. Schoggins JW, et al. A diverse range of gene products are effectors of the type I interferon antiviral response. Nature. 2011;472:481–485. - PMC - PubMed
    1. Isaacs A, Lindenmann J. Virus interference. I. The interferon. Proc R Soc Lond B Biol Sci. 1957;147:258–267. - PubMed
    1. Uze G, Lutfalla G, Gresser I. Genetic transfer of a functional human interferon alpha receptor into mouse cells: cloning and expression of its cDNA. Cell. 1990;60:225–234. - PubMed
    1. Novick D, Cohen B, Rubinstein M. The human interferon alpha/beta receptor: characterization and molecular cloning. Cell. 1994;77:391–400. - PubMed

Publication types

MeSH terms