Review
. 2012 Nov-Dec;47(6):502-30.
doi: 10.3109/10409238.2012.729561. Epub 2012 Oct 9.

Understanding cytokine and growth factor receptor activation mechanisms

Affiliations
Review

Understanding cytokine and growth factor receptor activation mechanisms

Mariya Atanasova et al. Crit Rev Biochem Mol Biol. 2012 Nov-Dec.

Abstract

Our understanding of the detailed mechanism of action of cytokine and growth factor receptors - and particularly our quantitative understanding of the link between structure, mechanism and function - lags significantly behind our knowledge of comparable functional protein classes such as enzymes, G protein-coupled receptors, and ion channels. In particular, it remains controversial whether such receptors are activated by a mechanism of ligand-induced oligomerization, versus a mechanism in which the ligand binds to a pre-associated receptor dimer or oligomer that becomes activated through subsequent conformational rearrangement. A major limitation to progress has been the relative paucity of methods for performing quantitative mechanistic experiments on unmodified receptors expressed at endogenous levels on live cells. In this article, we review the current state of knowledge on the activation mechanisms of cytokine and growth factor receptors, critically evaluate the evidence for and against the different proposed mechanisms, and highlight other key questions that remain unanswered. New approaches and techniques have led to rapid recent progress in this area, and the field is poised for major advances in the coming years which promise to revolutionize our understanding of this large and biologically and medically important class of receptors.


Figures

Figure 1
Figure 1. Cartoon illustrating the structures and compositions of typical growth factor and cytokine receptors
(a) (Left) growth factor receptor, with a kinase domain as an intrinsic part of its cytoplasmic structure. (Right) cytokine receptor, with a signaling kinase noncovalently associated with its cytoplasmic domain. (b) Examples of stiochiometric compositions that have been reported for cytokine and growth factor receptors. Ligands (L) are shown in green, and receptor proteins (α, β or γ) are shown in blue, red or magenta. (A color version of this figure is available in the inline version of this article.)
Figure 2
Figure 2. Ligand-receptor cross-reactivity in the ErbB receptor family
Ligands and receptors in this family show a complex pattern of cross-reactivities. Complicating matters yet further, the receptor protein ErbB2 does not bind directly to any known ligand, but when present on cells is the preferred heterodimerization partner for other ErbB family members. In contrast, ErbB3 can bind ligands, but lacks an active kinase domain and so can signal only as part of a heterodimer with a kinase-active ErbB partner. See text for further details. (A color version of this figure is available in the inline version of this article.)
Figure 3
Figure 3. Experimental x-ray structures showing examples of the variety of ligand-receptor complex geometries observed for cytokine and growth factor receptors
(a) Complex of hGH (green) with two molecules of the extracellular domain of hGH-R (blue) (Cunningham, Ultsch et al. 1991). (b) Complex of IL-4 (green) with the extracellular domains of IL-4Rα (blue) and γc (red) (LaPorte, Juo et al. 2008). (c) Complex of IL-2 (green) with the extracellular domains of IL-2Rα (magenta), IL-2Rβ (blue) and γc (red) (Stauber, Debler et al. 2006). (d) Side view (left) and top view (right) of the hexameric complex comprising two molecules of IL-6 (green) with two molecules each of the extracellular domains of IL-6Rα (blue) and gp130 (red) (Boulanger, Chow et al. 2003). (e) Top view of the complex of TGFβ1 (green) with two molecules each of the extracellular domains of TGFβRI (red) and TGFβRII (blue) (Radaev, Zou et al. 2010). (f) Complex comprising two copies of EGF (green) plus two copies of the EGF-R extracellular domain (blue and red) (Ogiso, Ishitani et al. 2002). (g) Complex of TNFβ (green), also known as LTα, with three copies of the TNFRp55 extracellular domain (blue) (Banner, D'Arcy et al. 1993). (h) Side view (left) and top view (right) of the complex containing two copies of FGF2 (green) in complex with two copies of FGF-R extracellular domain (blue) and two molecules of heparin (colored by atom; C = yellow) (Pellegrini, Burke et al. 2000). (A color version of this figure is available in the inline version of this article.)
Figure 4
Figure 4. Scheme illustrating the generic mechanism for grown factor receptor signaling
(a) Step (i): upon assembly of the activated receptor complex the kinase domains associated with the receptor’s cytoplasmic region phosphorylate each other and then additional sites (added phosphate groups are indicated by red stars). Step (ii): Cytoplasmic signaling proteins (orange and purple) are recruited to the newly phosphorylated docking sites on the receptor, and (Step (iii) are themselves in turn phophorylated. Some of these recruited proteins serve as docking sites for additional cytoplasmic signaling proteins (Step (iv)), which mediate additional downstream signaling processes, while others dissociate from the receptor and then form phosphopeptide-mediated complexes with each other or with other transcription factor proteins (Step (v)), after which they migrate to the nucleus where they interact with specific promoter sites ion DNA to modulate the transcription of target genes. (b) Illustration of the asymmetric interaction between EGR-R kinase domains that results in kinase activation (Zhang, Gureasko et al. 2006). EGF-R is colored blue or pink, while the bound EGF is colored pale green. The extracellular and cytoplasmic domains represent separate experimental crystal structures of these complexes, while the connecting segment is drawn arbitrarily. The N-terminal portion of one EGF-R kinase domain is colored dark blue, while the corresponding portion of the identical kinase domain from the other EGF-R molecule is colored dark red, to highlight the asymmetric nature of the interaction. (A color version of this figure is available in the inline version of this article.)
Figure 5
Figure 5. Two possible mechanisms accounting for how ligand binding brings about the activation of a dimeric receptor
(a) Ligand-induced receptor dimerization. (b) Allosteric rearrangement of a pre-associated receptor dimer. (A color version of this figure is available in the inline version of this article.)
Figure 6
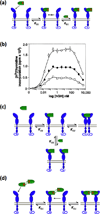
Figure 6. Potential explanations for key mechanistic findings in terms of ligand-induced dimerization
(a) The observation that a ligand that is mutated to inactivate its Site 2 binding surface can act as an antagonist of homotyopic receptors such as hGH-R and EPO-R in cellular assays can be accounted for if each receptor chain binds a separate ligand molecule through its intact Site 1, with no Site 2 interaction to drive recruitment of a second receptor chain into an activated ternary complex. (b) Mutants of hGH with reduced but not eliminated Site 2 binding show a bell-shaped dose response. Reproduced from (Fuh, Cunningham et al. 1992), with permission. ©American Association for the Advancement of Science, 1992. (c) The observation that ligands for homotypic receptors such as hGH-R and EPO-R give bell-shaped dose-response relationships in cellular assays can be explained if high ligand concentrations drive the receptor to a non-signaling state similar to that described in (a). (d) The observation that an antagonistic ligand mutant of the type described in (a) can be converted to an agonist by covalent dimerization can be explained if each ligand monomer binds a separate receptor chain via the unmutated Site 1, thereby bringing two receptor chains together due to the covalent tether. (A color version of this figure is available in the inline version of this article.)
Figure 7
Figure 7. Competitive versus noncompetitive inhibition reveals mechanistic properties of the heterodimeric receptor for IL-4
(a) (Left panel) antibody that binds to the IL-4Rα chain and directly blocks ligand binding acts as a competitive antagonist in assays measuring the IL-4 dependent proliferation of T cells. Antibody concentrations are 0 (○), 0.41 (□), 1.23 (Δ), 3.7 (◇), 11.1 (∇) 33.3 (⌧) or 100 (◉) µg/ml. Inset plot shows that the concentration of IL-4 required to achieve a 50% maximal proliferative response (EC50) increases linearly with the concentration of inhibiting mAb, consistent with simple competitive inhibition. (Right panel) antibody that binds to the γc chain and blocks its recruitment into the activated receptor complex acts as a noncompetitive antagonist. Inset: EC(50) for IL-4 is independent of inhibitor concentration. Figure reproduced from (Whitty, Raskin et al. 1998), with permission. ©1998 by The National Academy of Sciences. (b) Scheme illustrating how noncompetitive inhibition by anti-γc mAb can be explained in terms of a mechanism of ligand-induced dimerization, in which IL-4 and the inhibitor bind to distinct and independent receptor components, and so the antibody cannot be outcompeted by increasing IL-4 concentration (Whitty, Raskin et al. 1998). (A color version of this figure is available in the inline version of this article.)
Figure 8
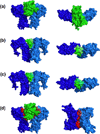
Figure 8. X-ray crystal structures of activated and inhibited forms of EPO-R
(a) The native EPO/EPO-R complex showing two molecules of the EPO-R extracellular domain (dark blue and light blue) bound to one molecule of EPO (green), as viewed from the side (left image), or from the top (right image) to show the angle at which the two receptor molecules are juxtaposed (Syed, Reid et al. 1998). (b) The complex of EPO-R with the antagonistic EPO mimetic peptide EMP33 (Livnah, Johnson et al. 1998). (c) The complex of EPO-R with the agonistic EPO mimetic peptide EMP1 (Livnah, Stura et al. 1996). (d) The native EPO/EPO-R complex (left image) and the antiparallel dimer seen for unbound EPO-R (right image) (Livnah, Stura et al. 1999), with the residues that make direct contact with EPO colored in red in both images, showing that the same regions of the receptor proteins that contact EPO also mediate receptor/receptor contact in the crystal of unbound EPO-R. (A color version of this figure is available in the inline version of this article.)
Figure 9
Figure 9. Small molecules that have been reported to activate cytokine or growth factor receptors
(a) G-CSF receptor agonist SB247464 (Tian, Lamb et al. 1998). (b) TPO-R agonist TM-41 (Kimura, Kaburaki et al. 1998). (c) The FDA-approved TPO-R agonist drug, eltrombopag (Cheng, Saleh et al. 2011). (d) TrkA agonist gambogic amide (Jang, Okada et al. 2007). (e) TrkB agonist 7,8-dihydroxyflavone (Jang, Liu et al. 2010).
Figure 10
Figure 10. Scheme illustrating the difficulty in reconciling TNF-R pre-association via N-terminal PLAD domains with the known structure of the ligand-receptor complex
The extracellular portion of TNF-Rp55 comprises four cysteine-rich domains (CRDs). The cartoon show three molecules of TNF-Rp55 (blue) pre-associated via their N-terminal PLAD motifs, illustrating the difficulty in accounting how the large TNF ligand (green) gains access to the interior of this three-fold cage. The experimental structure on the right shows the relative sizes of TNFβ (green) compared to CRDs 2 and 3 of TNF-Rp55 (blue) (Banner, D'Arcy et al. 1993). (A color version of this figure is available in the inline version of this article.)
Figure 11
Figure 11. The mechanistic continuum that connects the ligand-induced dimerization and pre-associated receptor mechanisms
The scheme reflects the fact that any receptor with even a weak tendency to self-associate will form pre-associated dimers if present at local concentrations on the membrane that exceed KD2’. Conversely, even strongly self-associating receptors will predominantly exist as independently diffusing monomers if the local expression density falls below KD2’. Thus, which mechanism is followed is not an intrinsic property of a particular receptor, but rather is a contextual function of expression level and of other factors that affect the membrane localization or interaction affinity of the receptor components. (A color version of this figure is available in the inline version of this article.)
Figure 12
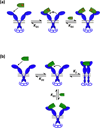
Figure 12. Potential explanations for key mechanistic findings in terms of pre-associated receptors
(a) The observation that a ligand that is mutated to inactivate its Site 2 binding surface can act as an antagonist of homotyopic receptors such as hGH-R and EPO-R in cellular assays (see Figure 6a) can be accounted for if each receptor chain in the pre-associated receptor dimer can bind a separate ligand molecule through its Site 1 binding surface, with no activating structural reorganization. (b) The observation that ligands for homotypic receptors such as hGH-R and EPO-R give bell-shaped dose-response relationships in cellular assays (see Figures 6b, c) can similarly be accounted for by high ligand concentrations driving the receptor to a non-signaling state similar to that described in (a). (A color version of this figure is available in the inline version of this article.)
Figure 13
Figure 13. Proposed mechanism for the activation of RET by ART plus GFRα3, and its link to function (Schlee, Carmillo et al. 2006)
(a) “Reaction tesseract” illustrating potential pathways by which initial binding of ART to different possible resting states for the receptor (green squares) could lead to assembly of the activated receptor complex (pink square with bold red outline). The proposed pathway is indicated by the black equilibrium arrows. (b) Proposed mechanism for the activation of RET by ART plus GFRα3. (c) Simulation showing how the activation mechanism shown in (b), together with the experimentally-determined values for KD1–KD4, predicts how the different species on the activation pathway will vary with ART concentration, for NB41A3-GFRα3 cells expressing RET plus GFRα3. The filled circles show experimental measurements of phosphoRET levels on NB41A3-GFRα3 cells stimulated with different concentrations of ART, normalized to the same y axis scale. (A color version of this figure is available in the inline version of this article.)

References

    1. Abe S, Sasaki R, Masuda S. An extra high dose of erythropoietin fails to support the proliferation of erythropoietin dependent cell lines. Cytotechnology. 2011;63(2):101–108. - PMC - PubMed
    1. Adar R, Monsonego-Ornan E, David P, Yayon A. Differential activation of cysteine-substitution mutants of fibroblast growth factor receptor 3 is determined by cysteine localization. J Bone Miner Res. 2002;17(5):860–868. - PubMed
    1. Airaksinen MS, Saarma M. The GDNF family: signalling, biological functions and therapeutic value. Nat Rev Neurosci. 2002;3(5):383–394. - PubMed
    1. Airaksinen MS, Titievsky A, et al. GDNF family neurotrophic factor signaling: four masters, one servant? Mol Cell Neurosci. 1999;13(5):313–325. - PubMed
    1. Alvarado D, Klein DE, et al. Structural basis for negative cooperativity in growth factor binding to an EGF receptor. Cell. 2010;142(4):568–579. - PMC - PubMed

Publication types

LinkOut - more resources