. 2012 Dec;33(9):1507-15.
doi: 10.1097/MAO.0b013e31826dbc80.

Intraoperative round window recordings to acoustic stimuli from cochlear implant patients

Affiliations

Intraoperative round window recordings to acoustic stimuli from cochlear implant patients

Baishakhi Choudhury et al. Otol Neurotol. 2012 Dec.

Abstract

Hypothesis: Acoustically evoked neural and hair cell potentials can be measured from the round window (RW) intraoperatively in the general population of cochlear implant recipients.

Background: Cochlear implant performance varies greatly among patients. Improved methods to assess and monitor functional hair cell and neural substrate before and during implantation could potentially aid in enhanced nontraumatic intracochlear electrode placement and subsequent improved outcomes.

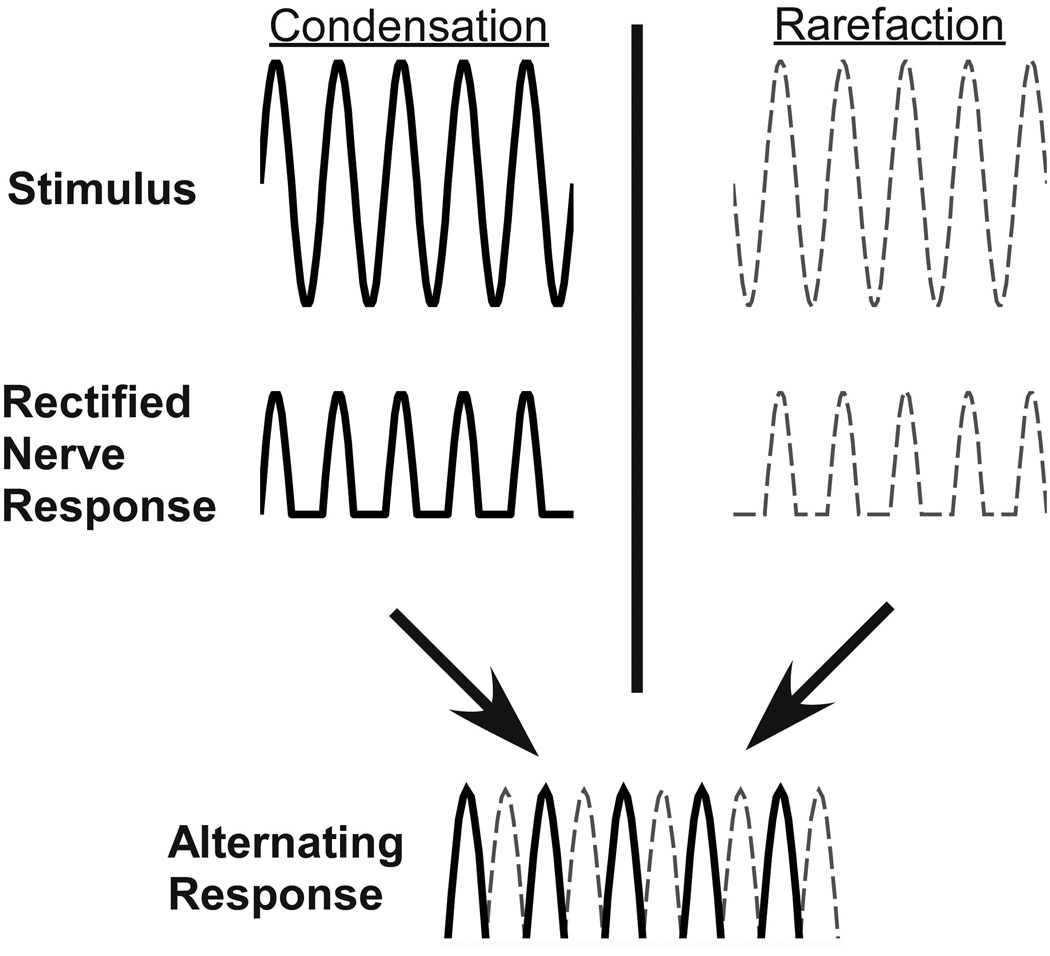
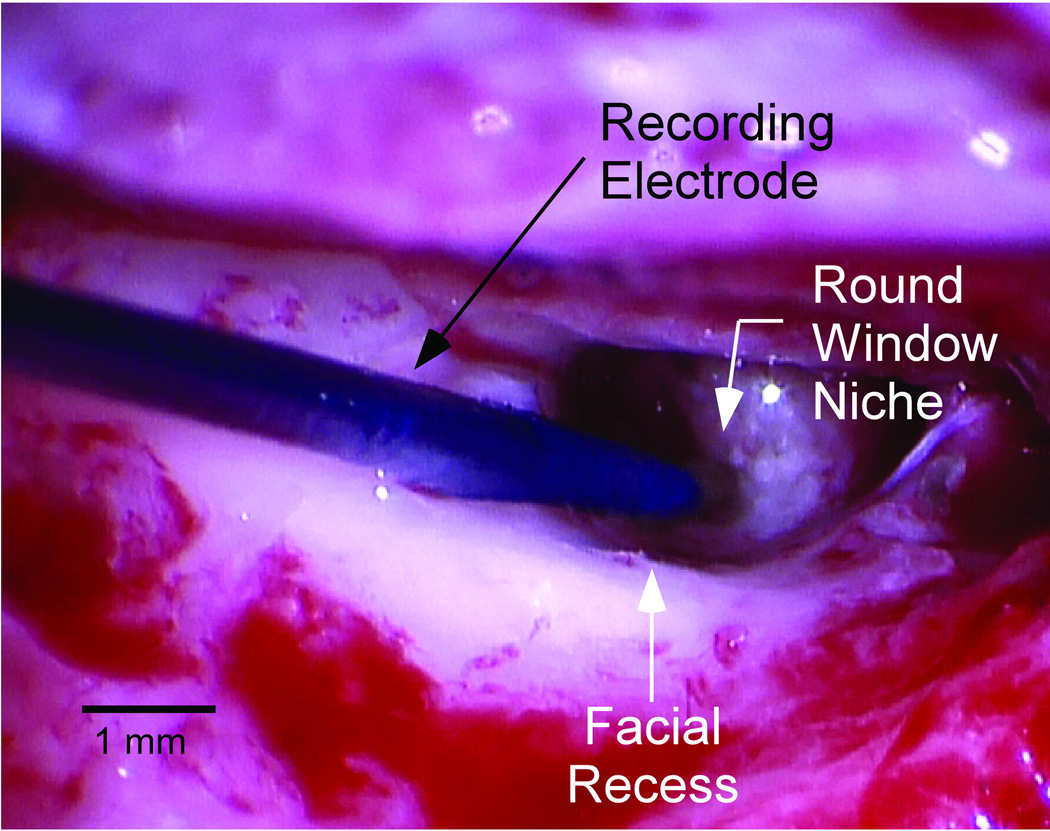
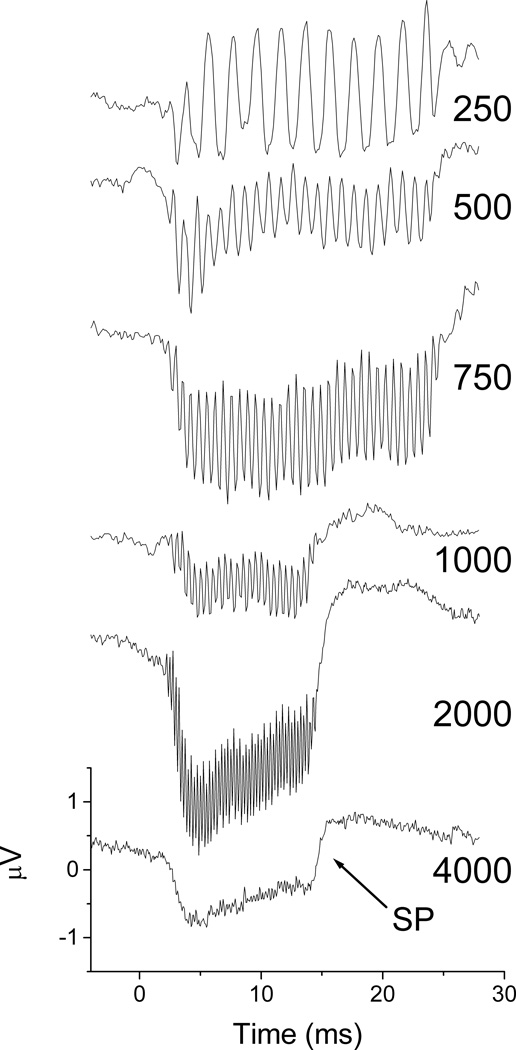
Methods: Subjects (1-80 yr) undergoing cochlear implantation were included. A monopolar probe was placed at the RW after surgical access was obtained. The cochlear microphonic (CM), summating potential (SP), compound action potential (CAP), and auditory nerve neurophonic (ANN) were recorded in response to tone bursts at frequencies of 0.25 to 4 kHz at various levels.

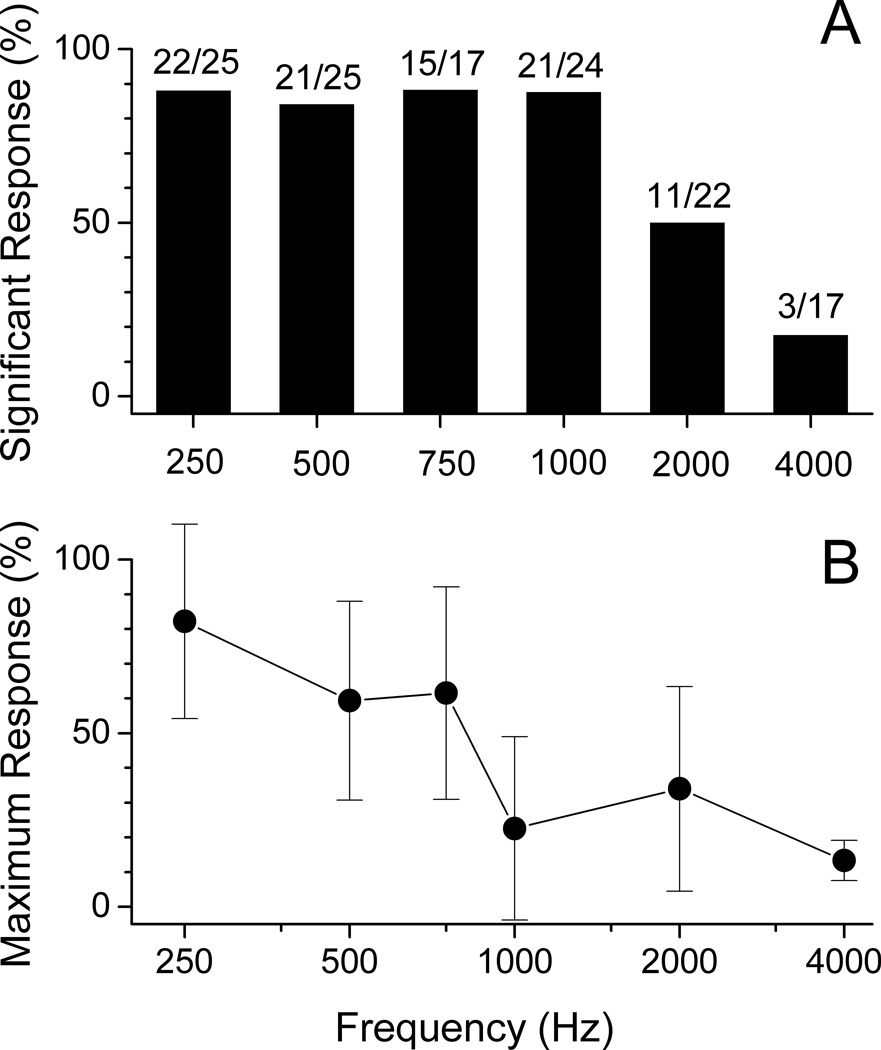
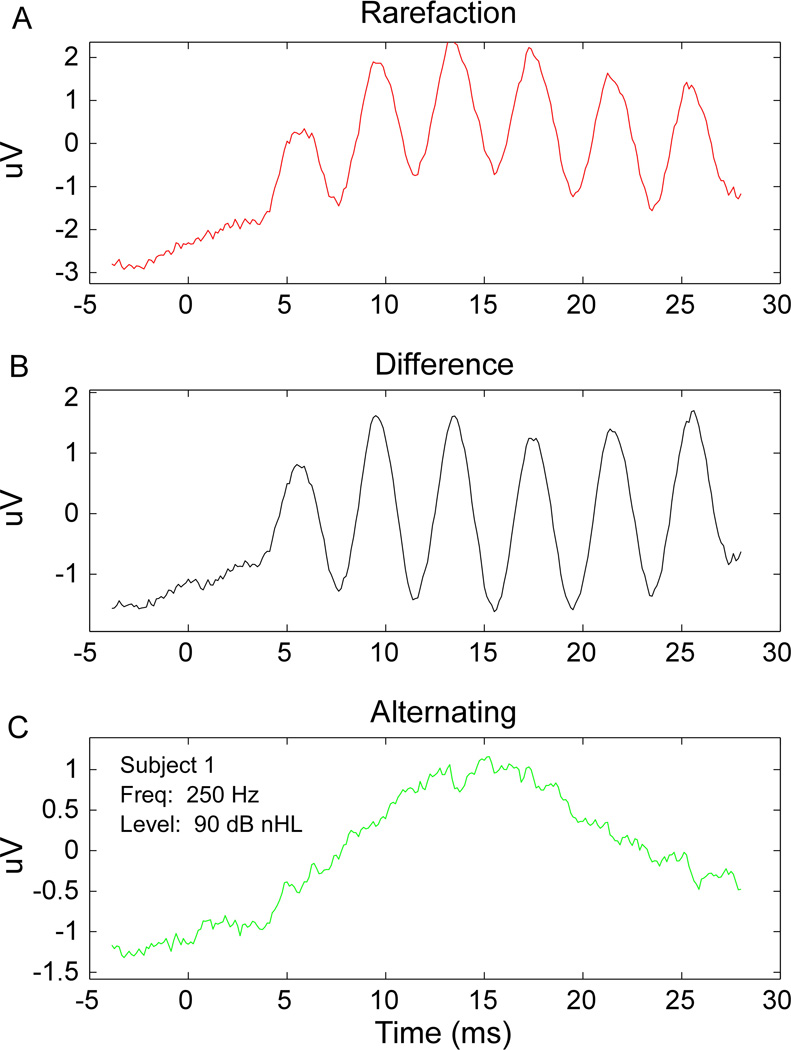
Results: Measurable hair cell/neural potentials were detected to 1 or more frequencies in 23 of 25 subjects. The greatest proportion and magnitude of cochlear responses were to low frequencies (<1,000 Hz). At these low frequencies, the ANN, when present, contributed to the ongoing response at the stimulus frequency. In many subjects, the ANN was small or absent, whereas hair cell responses remained.

Conclusion: In cochlear implant recipients, acoustically evoked cochlear potentials are detectable even if hearing is extremely limited. Sensitive measures of cochlear and neural status can characterize the state of hair cell and neural function before implantation. Whether this information correlates with speech performance outcomes or can help in tailoring electrode type, placement or audiometric fitting, can be determined in future studies.


Figures

Figure 1
Figure 1
Schematic showing the origin of the auditory nerve neurophonic (ANN) in the alternating response waveform. First row, labeled “Stimulus” shows a sinusoidal tone burst in two phases with a difference of 180 degrees (Condensation and Rarefaction). Second row, labeled “Rectified Nerve Response”, shows the ANN component of the response to each phase of the sinusoidal stimulus. A positive going response to each positive going portion of the sinusoidal stimulus is seen (1/2 wave rectification). The last row, labeled “Alternating Response” shows the combination of the ANN response to each phase, which results in a waveform that is twice the original stimulus sinusoidal wave frequency. This response is the alternating phase response, which isolates the neural response.
Figure 2
Figure 2
A photograph taken through the operating microscope of the intraoperative recording setup showing the sterile monopolar probe placed in the round window niche after surgical access was gained.
Figure 3
Figure 3
Example of a typical response seen to a 500 Hz tone at 90 dB nHL. A. The averaged waveforms for both the condensation and rarefaction phases show distortion compared to the tone stimuli. B. Fast Fourier Transform (FFT) spectral analysis of 2A, shows that the distortion is harmonically related to the stimulus frequency, appearing at 1 and 2 kHz. C. The difference between the two waveforms in 2A. D. The subtraction removes most of the distortion yielding a single peak at the stimulus frequency in the spectrum. Open circle depicts calculated noise floor plus three standard deviations of the noise. A peak larger than this was determined to be significant. E. The averages of the waveforms in 2A, called alternating. The averaging removes the energy at the stimulus frequency and yields a residual response at twice the stimulus frequency. The compound action potential (CAP) is seen towards the beginning of the stimulus, and the auditory nerve neurophonic (ANN), phase locked neural response, is shown lasting the duration of the stimulus. F. The FFT retains only the energy of the harmonic distortion, with the largest peak at twice the stimulus frequency. Again, the open circle represents the calculated noise floor plus three standard deviations of the noise.
Figure 4
Figure 4
A. Summary of the percent of subjects that had a significant response at each frequency. A greater percentage of subjects were noted to have significant responses (defined as responses greater than the noise level plus three times the standard deviation in the six bins used for the noise measurements) at 250–1,000 Hz compared to 2,000–4,000 Hz. B. Depicts the magnitudes of the response at each frequency across subjects, normalized to the maximum for each subject. The bars are standard error of the mean. Most subjects showed the largest responses to lower frequencies, the magnitudes of the response declined over the frequency range.
Figure 5
Figure 5
Comparisons of intraoperative threshold recordings at a single frequency and preoperative audiogram threshold at the same frequency. A. Shows comparison for difference waveform response. The arrow highlights one of the cases where the physiological threshold was less than behavioral threshold. B. Compares preoperative audiogram threshold with threshold from twice the stimulus frequency using the alternating waveform. The arrow points to the same subject as in 4A, which now shows a better match to the behavioral threshold. Asterisks represent subjects that did not show a response in the alternating waveform at the highest level tested (90 dB nHL).
Figure 6
Figure 6
The rarefaction, A, difference, B, and alternating, C, waveforms are shown for Subject 1. Given this stimulus (250 Hz tone at 90 dB nHL) a robust response in the rarefaction and difference waveform is evident, with no distortion in the rarefaction waveform. No response is noted in the alternating waveform. In addition, there is no CAP, indicating a differential hair cell and neural response to the stimulus.
Figure 7
Figure 7
Alternating responses across frequencies at 90 dB nHL for Subject 15 that showed a large summating potential (SP). A SP was present at 500 Hz and increased at higher frequencies. The auditory nerve neurophonic (ANN) represents phase-locking of neural elements, and is a ½-wave rectified version of the original signal. The phase-locked response was present until 2 kHz.

References

    1. Firszt JB, Holden LK, Skinner MW, et al. Recognition of speech presented at soft to loud levels by adult cochlear implant recipients of three cochlear implant systems. Ear and hearing. 2004;25:375–387. - PubMed
    1. Gomaa NA, Rubinstein JT, Lowder MW, et al. Residual speech perception and cochlear implant performance in postlingually deafened adults. Ear and hearing. 2003;24:539–544. - PubMed
    1. Francis HW, Niparko JK. Cochlear implantation update. Pediatric clinics of North America. 2003;50:341–361. viii. - PubMed
    1. Rubinstein JT, Parkinson WS, Tyler RS, et al. Residual speech recognition and cochlear implant performance: effects of implantation criteria. The American journal of otology. 1999;20:445–452. - PubMed
    1. Friedland DR, Venick HS, Niparko JK. Choice of ear for cochlear implantation: the effect of history and residual hearing on predicted postoperative performance. Otology & neurotology : official publication of the American Otological Society, American Neurotology Society [and] European Academy of Otology and Neurotology. 2003;24:582–589. - PubMed

Publication types

MeSH terms