. 2013 Jan;33(1):137-45.
doi: 10.1038/jcbfm.2012.147. Epub 2012 Oct 10.

Dynamic spatio-temporal imaging of early reflow in a neonatal rat stroke model

Affiliations

Dynamic spatio-temporal imaging of early reflow in a neonatal rat stroke model

Pierre-Louis Leger et al. J Cereb Blood Flow Metab. 2013 Jan.

Abstract

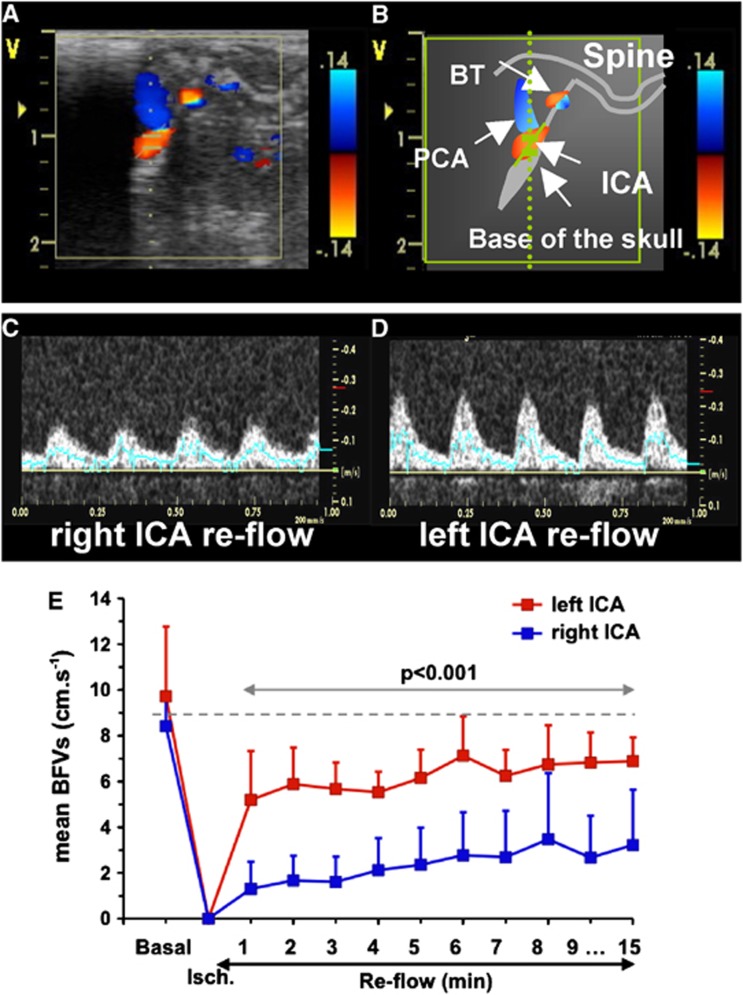
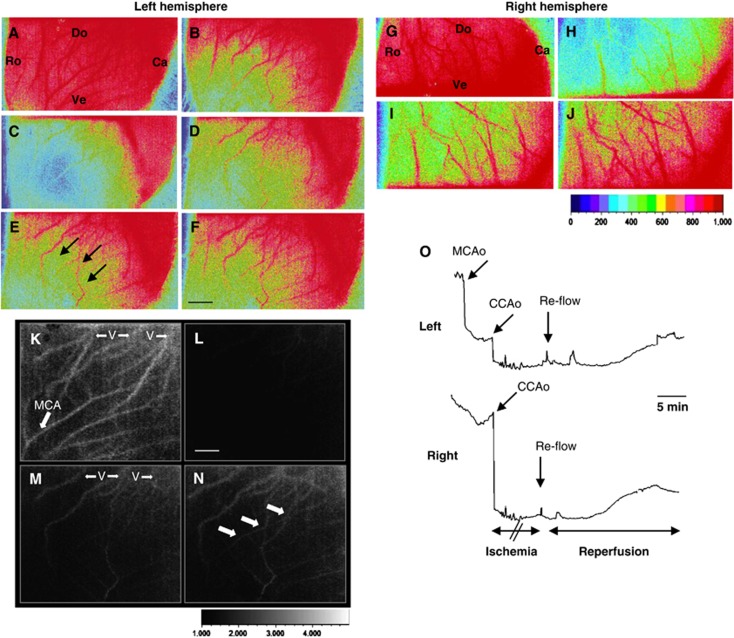
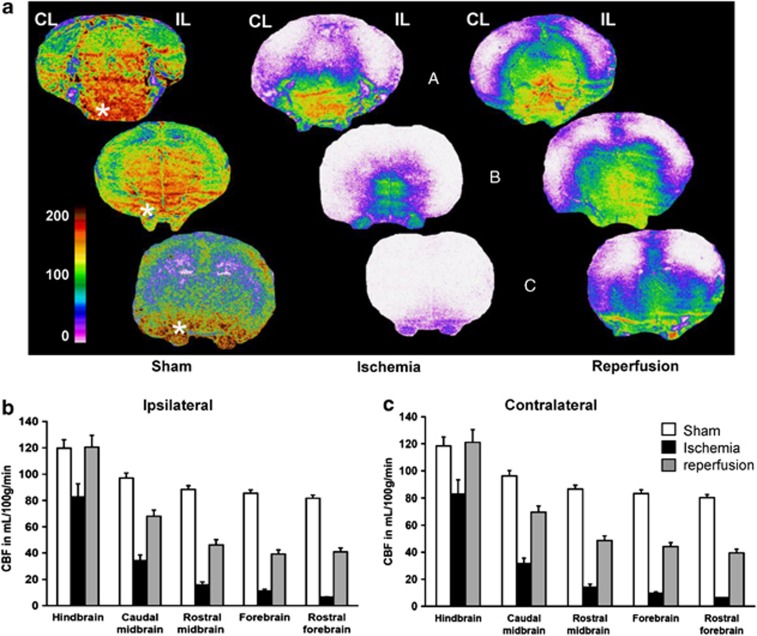
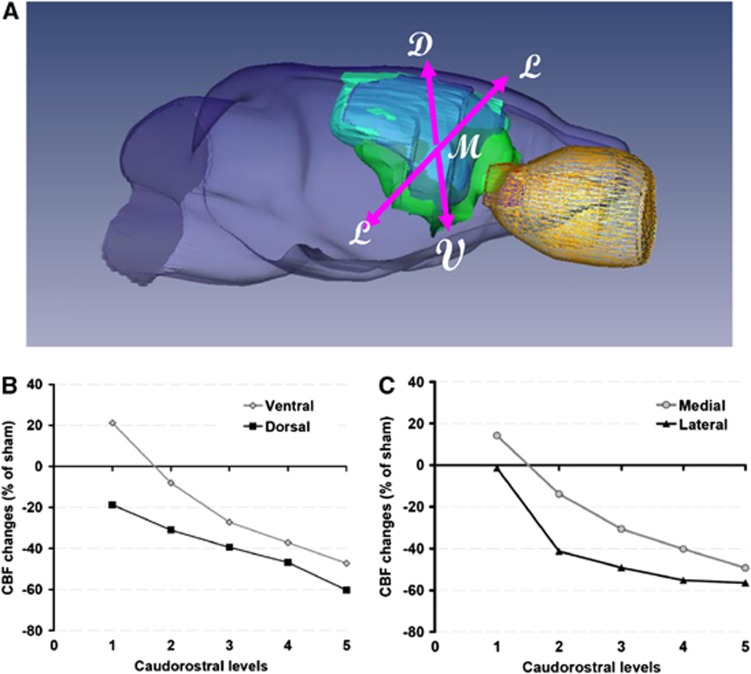
The aim of the study was to better understand blood-flow changes in large arteries and microvessels during the first 15 minutes of reflow in a P7 rat model of arterial occlusion. Blood-flow changes were monitored by using ultrasound imaging with sequential Doppler recordings in internal carotid arteries (ICAs) and basilar trunk. Relative cerebral blood flow (rCBF) changes were obtained by using laser speckle Doppler monitoring. Tissue perfusion was measured with [(14)C]-iodoantipyrine autoradiography. Cerebral energy metabolism was evaluated by mitochondrial oxygen consumption. Gradual increase in mean blood-flow velocities illustrated a gradual perfusion during early reflow in both ICAs. On ischemia, the middle cerebral artery (MCA) territory presented a residual perfusion, whereas the caudal territory remained normally perfused. On reflow, speckle images showed a caudorostral propagation of reperfusion through anastomotic connections, and a reduced perfusion in the MCA territory. Autoradiography highlighted the caudorostral gradient, and persistent perfusion in ventral and medial regions. These blood-flow changes were accompanied by mitochondrial respiration impairment in the ipsilateral cortex. Collectively, these data indicate the presence of a primary collateral pathway through the circle of Willis, providing an immediate diversion of blood flow toward ischemic regions, and secondary efficient cortical anastomoses in the immature rat brain.


Figures

Figure 1
Figure 1
Ischemia–reperfusion induces cortical infarct in P7 rat brain. Upper: Representative apparent diffusion coefficient (ADC) map at 10 minutes after ischemia–reperfusion showing a cortical lesion at Bregma 1.32 and −3.24 mm, respectively. Middle: Representative T2-weighted image at 2 hours after ischemia–reperfusion showing the cortical lesion. Lower: Representative cresyl violet (CV)-stained sections from this animal at 48 hours after ischemia–reperfusion.
Figure 2
Figure 2
Time course of mean blood-flow velocities (mBFVs) in the left and right internal carotid artery (ICA) using ultrasound (US) imaging during ischemia and reflow (n=6). (A) Para-sagittal 2D-color-coded image of brain arteries. (B) Schematic representation of image A with localization of arteries (white arrows); BT, basilar trunk; ICA, internal carotid artery; PCA, posterior cerebral artery. (C, D) Typical example of color-coded (C) and pulsed Doppler images in the left (C) and right (D) ICA during reperfusion. (E) Mean BFVs in left and right ICA were plotted in basal, during ischemia (at 40 minutes) and during the first 15 minutes of the reperfusion (n=6). Note that mBFVs in the right ICA were significantly reduced as compared with values obtained in the left ICA.
Figure 3
Figure 3
Typical example of spatio-temporal evolution of blood changes in the cerebral cortex in response to neonatal ischemia and reperfusion. (AF and KN) Laser speckle contrast (LSC) images (15 × 11 mm) in the left (AF) and right (KN) hemisphere are shown in basal (A, K), after middle cerebral artery (MCA) electrocoagulation (MCAo) (B), left and right CCA occlusion (CCAo) (C, L) and during reperfusion at 5 (D, M), 15 (E), and 30 (F, N) minutes. Ro, rostral; Ca, caudal; Do, dorsal; Ve, ventral. Note the expansion of the area with relative cerebral blood flow (rCBF) of ∼50% of basal value (three black arrows). (GJ) LSC imaging showing blood flow in veins (V) and vessels in the cortical surface in basal (G), during ischemia (H), and during reperfusion at 5 (I) and 30 (J) minutes. Note the presence of blood flow in the terminal segment of the MCA (white arrows). (O) Changes in rCBF (mean of six regions of interest (ROIs)±s.d.) in six animals subjected to ischemia–reperfusion. Upper: Representative laser-Doppler tracing in the left and right hemisphere from an ischemic animal showing perfusion deficit after MCAo and further decline after occlusion of both CCA (CCAo), and gradual reflow after CCAo release (arrow). Black scale bar represents 2 mm and white scale bar represents 1.25 mm.
Figure 4
Figure 4
Cerebral blood flow (CBF) distribution in sham-operated, ischemic, and reperfused P7 rat pups. (A) Autoradiograms of coronal sections at three caudorostral levels (hindbrain, a; midbrain, b; forebrain, c) showing local tissue perfusion. The color-coded scale indicates that CBF values occasionally attained 200 mL/100 g per minute. Highly perfused regions are found in the pons and medulla, and rostrally in the ventral and medial mesencephalic brain stem and diencephalon. Lower blood-flow values are found in the lateral and dorsal cortical mantel, and in the dorsal subcortical forebrain. Remarkably, the trigeminal nerve (beneath low the brain *) clearly appears highly perfused, and somewhat preserved despite ischemia. (B) Blood flow at five caudorostral levels in the hemibrain ipsilateral (IL) and (C) contralateral (CL) to the middle cerebral artery electrocoagulation (MCAo). Absolute CBF values are decreasing in both hemibrains along a main caudorostral gradient in all conditions of perfusion, sham-operated, ischemic, and reperfused rats. A global repeated measure (RM)-ANOVA established that caudorostral blood-flow gradients are significantly different for all conditions of perfusion (P<0.0001). Values are mL/100 g per minute, mean±s.e.m. for sham-operated (n=4), ischemic (n=5), and reperfused (n=6) P7 rats. The regions of interest are for the hindbrain the pontic and medullar reticular formation, the spinal trigeminal and vestibular nuclei, the colliculi, the cerebellum and the caudal (visual) cortex; for the caudal midbrain, the pontine and deep mesencephalic nuclei, the periaqueductal gray, the subthalamic area and hypothalamus, the lateral hippocampus, occipital (visual and auditory) and retrosplenial cortical areas; for the rostral midbrain, the thalamus, the dorsal hippocampus, the posterior parietal (somatosensory-S1 barrel field and limb, S2, and motor M1–M2) cortical areas, and the amygdala and piriform cortex; for the forebrain, the striatum, the anterior dorsal thalamus, the anterior hypothalamic area, and the anterior parietal, cingular and piriform cortical areas; and for the rostral forebrain, the caudate head, the septum, the frontal (S1-jaw and motor) cortical areas, the orbital cortex, and the olfactory tubercles and anterior olfactory nuclei.
Figure 5
Figure 5
Regional cerebral blood flow (CBF) profiles during reperfusion. (A) Representative three-dimensional volumetric reconstruction from a P7 rat brain at 5 hours after ischemia (green, diffusion-weighted image; blue, T2-weighted image; yellow, eye); D, dorsal; M, medial; V, ventral; L, lateral. (B, C) Blood-flow changes are expressed in percent change of the values in the contralateral hemibrain of sham-operated rats. In each of the five rostrocaudal intervals of Figures 4B and 4C, four regions of interest were classified as ventral, dorsal, median, or lateral. Comparatively to sham-operated rats, blood-flow decline is progressively greater rostrally (RM-ANOVA, P<0.0001) for both the ventrodorsal (B) and the mediolateral (C) gradients.

References

    1. Badve CA, Khanna PC, Ishak GE. Neonatal ischemic brain injury: what every radiologist needs to know. Pediatr Radiol. 2012;42:606–619. - PubMed
    1. Pryds A, Tønnesen J, Pryds O, Knudsen GM, Greisen G. Cerebral pressure autoregulation and vasoreactivity in the newborn rat. Pediatr Res. 2005;57:294–298. - PubMed
    1. Manole MD, Foley LM, Hitchens TK, Kochanek PM, Hickey RW, Bayir H, et al. Magnetic resonance imaging assessment of regional cerebral blood flow after asphyxial cardiac arrest in immature rats. J Cereb Blood Flow Metab. 2009;29:197–205. - PMC - PubMed
    1. Liebeskind DS. Understanding blood flow: the other side of an acute arterial occlusion. Int J Stroke. 2007;2:118–120. - PubMed
    1. Girouard H, Iadecola C. Neurovascular coupling in the normal brain and in hypertension, stroke, and Alzheimer disease. J Appl Physiol. 2006;100:328–335. - PubMed

MeSH terms