. 2012:8:617.
doi: 10.1038/msb.2012.49.

The inoculum effect and band-pass bacterial response to periodic antibiotic treatment

Affiliations

The inoculum effect and band-pass bacterial response to periodic antibiotic treatment

Cheemeng Tan et al. Mol Syst Biol. 2012.

Abstract

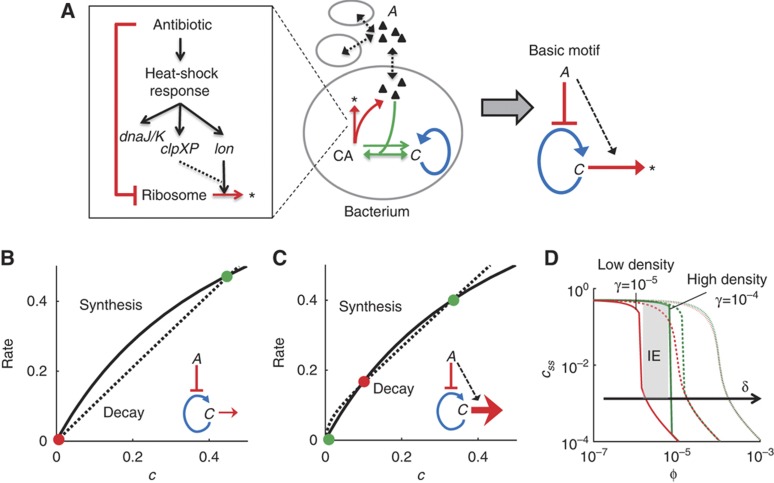
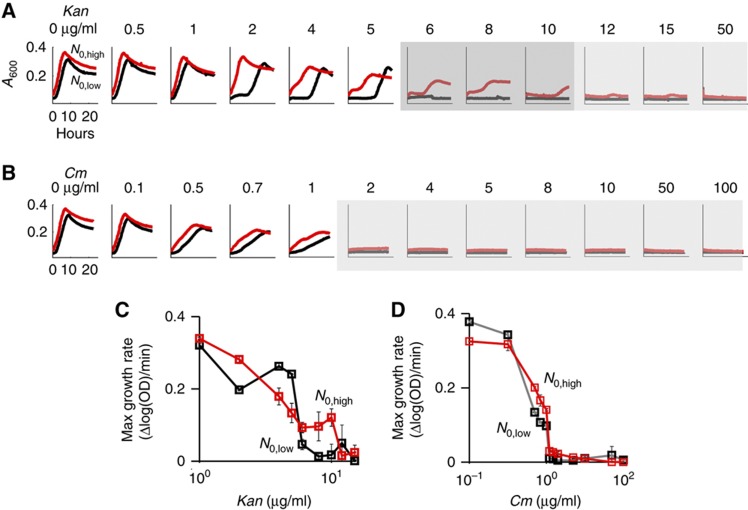
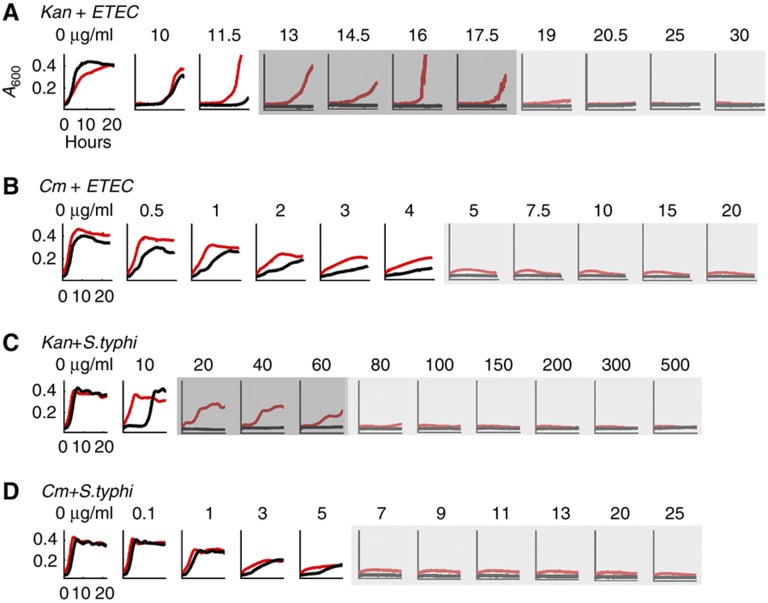
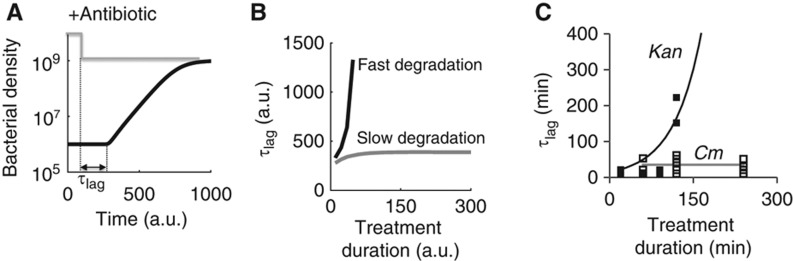
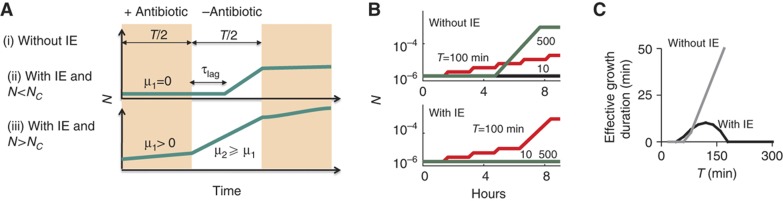
The inoculum effect (IE) refers to the decreasing efficacy of an antibiotic with increasing bacterial density. It represents a unique strategy of antibiotic tolerance and it can complicate design of effective antibiotic treatment of bacterial infections. To gain insight into this phenomenon, we have analyzed responses of a lab strain of Escherichia coli to antibiotics that target the ribosome. We show that the IE can be explained by bistable inhibition of bacterial growth. A critical requirement for this bistability is sufficiently fast degradation of ribosomes, which can result from antibiotic-induced heat-shock response. Furthermore, antibiotics that elicit the IE can lead to 'band-pass' response of bacterial growth to periodic antibiotic treatment: the treatment efficacy drastically diminishes at intermediate frequencies of treatment. Our proposed mechanism for the IE may be generally applicable to other bacterial species treated with antibiotics targeting the ribosomes.


Conflict of interest statement

The authors declare that they have no conflict of interest.

Figures

Figure 1
Figure 1
Antibiotic inhibition of the ribosome can lead to growth bistability. (A) Inhibition of ribosomes (C) by an antibiotic (A). CA represents complex of C and A, and * represents degradation products of C. The model accounts for the positive feedback of C, the transport of A across the bacterial membrane, the binding of A and C, and the degradation of C (left panel). The complex model (middle panel) corresponds to a basic network motif (right panel) that can generate bistability. See Supplementary Figure S1 for additional material. (B) With δ=10−4 (Equation 1), the system has one stable steady state. (C) With δ=10−6 (Equation 1), the system has two stable steady states. Green circles indicate stable steady states. Red circles indicate unstable steady states. The black lines represent the synthesis rate of C (first and second right hand side (RHS) terms of Equation 1). The dotted lines represent the decay and inhibition of C (third RHS term of Equation 1). ϕ=5 × 10⁻⁶ and γ=10−4 (Equation 1). (D) The region of IE shrinks and shifts to higher values of ϕ (antibiotic concentration) with increasing δ (degradation of C). At a high δ (slow degradation of C), a bacterial population would survive or go extinct regardless of its initial density (no IE). At a low δ (fast degradation of C), a bacterial population would exhibit IE (gray area). Red lines represent populations with low initial density (γ=10−5), green lines represent populations with high initial density (γ=10−4). c0=1, α=0.001, κ=0.5, δ=10−6 (full lines), δ=10−5 (dashed lines), and δ=10−4 (dotted lines) (Equation 1).
Figure 2
Figure 2
Kanamycin, but not chloramphenicol, led to IE in E. coli strain BL21. (A) Bacteria exhibited IE with kanamycin (6–10 μg/ml). Red and black lines represent high and low initial cell densities, respectively. Dark gray regions indicate that populations exhibited IE. Light gray regions indicate that both populations went extinct. (B) Bacteria did not exhibit IE with chloramphenicol. At both low and high initial densities, bacterial populations either survived or went extinct depending upon the applied concentration of chloramphenicol. See additional results in Supplementary Figure S2. (C) Dose response of bacterial growth rates with increasing concentrations of kanamycin. Red and black lines represent high and low initial cell density, respectively. Maximum growth rates were used as more sensitive metrics of bacterial growth as compared with absolute differences in optical densities. (D) Dose response of bacterial growth rates with increasing concentrations of chloramphenicol. Source data is available for this figure in the Supplementary Information.
Figure 3
Figure 3
Kanamycin, but not chloramphenicol, led to IE in enterotoxigenic E. coli (ETEC) and S. typhimurium. (A) ETEC exhibited the inoculum effect at 13–17.5 μg/ml kanamycin. Red and black lines represent high and low initial cell density, respectively. Dark gray regions indicate that populations exhibited IE. Light gray regions indicate that both populations went extinct. (B) ETEC did not exhibit inoculum effect at all tested concentrations of chloramphenicol. (C) S. typhimurium exhibited the inoculum effect at 20–60 μg/ml kanamycin. (D) S. typhimurium did not exhibit inoculum effect at all tested concentrations of chloramphenicol. See additional results in Supplementary Figure S3. Source data is available for this figure in the Supplementary Information.
Figure 4
Figure 4
Perturbation of HSR and protein degradation shifted the IE region. (A) Fast ribosome turnover, and thus IE can be initiated by challenging bacteria with numerous antibiotics that stimulate HSR. HSR and ribosome degradation can be perturbed using temperature, chemical inhibitors, and knockouts. (B) IE is initiated with various antibiotics. Tetracycline (Tet) and chloramphenicol (Cm), which to do not induce HSR, did not lead to IE. In contrast, tobramycin (Tob), gentamicin, (Gen), nourseothricin (Nou), neomycin (Neo), puromycin (Pur), streptomycin (Str), and kanamycin (Kan), which induce HSR, resulted in IE. See sample results of Str, Pur, and Tet in Supplementary Figure S4. Dark gray regions indicate that populations exhibited IE. Light gray regions indicate that both populations went extinct. (C) Inhibition of serine proteases (Ser Inh, 10 μg/ml) shifted the bifurcation region to higher concentrations of kanamycin (Kan+Ser Inh, 12–15 μg/ml). Similarly, treatment with cysteine protease inhibitors (Cys Inh, 10 μg/ml) or aspartyl protease (Asp Inh, 10 μg/ml) inhibitors shifted the IE region to 8–12 μg/ml. Heat shock at 42°C shifted the bifurcation region to lower concentrations of kanamycin (Kan+42°C, 0.5–1 μg/ml). Inhibition of all proteases reversed this effect by shifting the IE region back to higher concentrations of kanamycin (Kan+42°C+Inh, 5–6 μg/ml). Chloramphenicol coupled with heat shock led to IE (Cm+42°C, 0.5–1 μg/ml), which was abolished by the inhibition of all proteases (Cm+42°C+Inh). See additional results in Supplementary Figure S4. (D) The wild-type BW25113 strain (BW) exhibited IE between 4 and 8 μg/ml. Knockout strain Δlon shrunk the IE region to between 5 and 8 μg/ml. Knockout strain ΔclpX shrunk the IE region to 5 μg/ml. As such, the IE region was shrunk by knockout of proteases, which is consistent with our model predictions and the perturbation results in (C).
Figure 5
Figure 5
Delayed bacterial recovery from transient antibiotic treatment. (A) Recovery of a bacterial population after the removal of an antibiotic. For modeling studies, we defined recovery time (τlag) as the time from the removal of the antibiotic to the time when bacterial density starts to increase. (B) Recovery time increased much faster with fast degradation of ribosomes (black line, degradation rate=10−1) than with slow degradation (gray line, degradation rate=10−6). k0=10−6, k1=0.1, V1=0.2, ku=0.1, kf=1, kb=0.1, kin=3, kout=0.03, kr=0.02, and Aout=10 (which corresponds to an intermediate concentration). See Supplementary Equations S1–S5 and S16. (C) Population recovery after transient antibiotic treatment. We incubated bacteria in a flow system (Supplementary Figure S5A and B) in medium supplemented with either 10 μg/ml kanamycin or 10 μg/ml chloramphenicol. After treatment for a specific duration (i.e., treatment duration), we washed bacteria using fresh medium, tracked population growth and quantified recovery time as the time required for a population to increase above its initial density after antibiotic treatment. When treated with kanamycin, recovery time increased significantly with treatment duration (filled squares). In contrast, with chloramphenicol, recovery time stayed nearly constant (open squares). Lines of best fit, as determined visually, are shown. See Supplementary Figure S5 for additional data. Source data is available for this figure in the Supplementary Information.
Figure 6
Figure 6
Modeling the impact of inoculum effect (IE) on periodic antibiotic treatment. (A) A simplified model that describes population dynamics in periodic pulses of an antibiotic. Cases (i) and (ii) cause the same dynamics as indicated by the top panel. Case (iii) causes the dynamics as indicated by the bottom panel. See Supplementary Figure S6A for functions of τlag. (B) IE is predicted to cause band-pass response of bacterial growth to periodic treatment (bottom panel). Without IE, bacterial density increased with increasing pulse periods (top panel). μ12=0.07, N0=10−6, Nc=10−5, and Nmax=10−3. Each line corresponds to a specific pulse period (T) as indicated next to the line. Note that in the bottom panel (with IE), time series of both T=500 and T=10 min are identical. (C) With IE, the effective growth duration (T/2−τlag) in each cycle first increases and then decreases with T, leading to band-pass bacterial response. Without IE, the effective growth duration increases monotonically with T. See Supplementary Figure S6 for additional data.
Figure 7
Figure 7
Kanamycin, but not chloramphenicol, caused band-pass response with periodic treatment. (A) Microscope images of bacterial growth in the flow system. At the 8th hour, bacterial densities increased with increasing pulse periods of chloramphenicol (10 μg/ml). In contrast, bacterial densities peaked at an intermediate pulse period (120 min) of kanamycin (10 μg/ml). (B) Bacteria exhibited ‘low-pass’ response in varying pulse periods of chloramphenicol. The number of bacteria increased with increasing pulse periods. (C) Bacteria exhibited ‘band-pass’ response in varying pulse periods of kanamycin. The number of bacteria increased significantly with the pulse period of 120 min (green line). Each error bar indicates the standard deviation of five microscope images. Representative time series were obtained from two experiments. See Supplementary Figure S7 for additional data. Source data is available for this figure in the Supplementary Information.

References

    1. Balenci D, Bernardi F, Cellai L, D'Amelio N, Gaggelli E, Gaggelli N, Molteni E, Valensin G (2008) Effect of Cu-II on the complex between kanamycin A and the bacterial ribosomal A site. Chembiochem 9: 114–123 - PubMed
    1. Bayles KW (2007) The biological role of death and lysis in biofilm development. Nat Rev Microbiol 5: 721–726 - PubMed
    1. Bollenbach T, Quan S, Chait R, Kishony R (2009) Nonoptimal microbial response to antibiotics underlies suppressive drug interactions. Cell 139: 707–718 - PMC - PubMed
    1. Bota DA, Davies KJ (2002) Lon protease preferentially degrades oxidized mitochondrial aconitase by an ATP-stimulated mechanism. Nat Cell Biol 4: 674–680 - PubMed
    1. Brook I (1989) Inoculum effect. Rev Infect Dis 11: 361–368 - PubMed

Publication types

MeSH terms