

Bayesian correlated clustering to integrate multiple datasets
- PMID: 23047558
- PMCID: PMC3519452
- DOI: 10.1093/bioinformatics/bts595
Bayesian correlated clustering to integrate multiple datasets
Abstract
Motivation: The integration of multiple datasets remains a key challenge in systems biology and genomic medicine. Modern high-throughput technologies generate a broad array of different data types, providing distinct-but often complementary-information. We present a Bayesian method for the unsupervised integrative modelling of multiple datasets, which we refer to as MDI (Multiple Dataset Integration). MDI can integrate information from a wide range of different datasets and data types simultaneously (including the ability to model time series data explicitly using Gaussian processes). Each dataset is modelled using a Dirichlet-multinomial allocation (DMA) mixture model, with dependencies between these models captured through parameters that describe the agreement among the datasets.
Results: Using a set of six artificially constructed time series datasets, we show that MDI is able to integrate a significant number of datasets simultaneously, and that it successfully captures the underlying structural similarity between the datasets. We also analyse a variety of real Saccharomyces cerevisiae datasets. In the two-dataset case, we show that MDI's performance is comparable with the present state-of-the-art. We then move beyond the capabilities of current approaches and integrate gene expression, chromatin immunoprecipitation-chip and protein-protein interaction data, to identify a set of protein complexes for which genes are co-regulated during the cell cycle. Comparisons to other unsupervised data integration techniques-as well as to non-integrative approaches-demonstrate that MDI is competitive, while also providing information that would be difficult or impossible to extract using other methods.
Figures
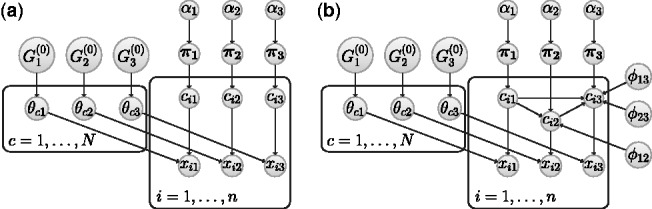
 denotes the
  observation in dataset k and is generated by mixture component
  . The prior probabilities associated with the distinct component allocation variables,
  , are given in the vector
  , which is itself assigned a symmetric Dirichlet prior with parameter
  . The parameter vector,
  , for component c in dataset k is assigned a
  prior. In (b), we additionally have
  parameters, each of which models the dependence between the component allocations of observations in dataset k and
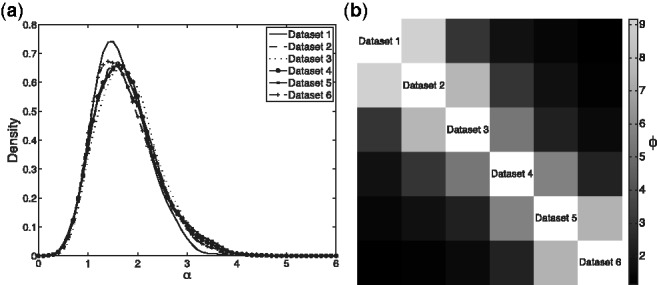
 . (b) Heatmap representation of the matrix with
  -entry
  , the posterior mean value for
References
-
- Balasubramanian R., et al. A graph-theoretic approach to testing associations between disparate sources of functional genomics data. Bioinformatics. 2004;20:3353–3362. - PubMed
-
- Barash Y., Friedman N. Context-specific Bayesian clustering for gene expression data. J. Comput. Biol. 2002;9:169–191. - PubMed
-
- Brock G., et al. clValid: an R package for cluster validation. J. Stat. Softw. 2008;25:1–22.
-
- Carlson M., et al. org.Sc.sgd.db: genome wide annotation for Yeast. 2010. R package version 2.6.3.
-
- Cheng Y., Church G.M. Biclustering of expression data. Proc. Int. Conf. Intell. Syst. Mol. Biol. 2000;8:93–103. - PubMed
Publication types
MeSH terms
Grants and funding
LinkOut - more resources
Full Text Sources
Other Literature Sources
Molecular Biology Databases
