. 2013 Jan 1;22(1):140-52.
doi: 10.1093/hmg/dds414. Epub 2012 Oct 9.

Deletion of Rictor in neural progenitor cells reveals contributions of mTORC2 signaling to tuberous sclerosis complex

Affiliations

Deletion of Rictor in neural progenitor cells reveals contributions of mTORC2 signaling to tuberous sclerosis complex

Robert P Carson et al. Hum Mol Genet. .

Abstract

Tuberous sclerosis complex (TSC) is a multisystem genetic disorder with severe neurologic manifestations, including epilepsy, autism, anxiety and attention deficit hyperactivity disorder. TSC is caused by the loss of either the TSC1 or TSC2 genes that normally regulate the mammalian target of rapamycin (mTOR) kinase. mTOR exists within two distinct complexes, mTOR complex 1 (mTORC1) and mTOR complex 2 (mTORC2). Loss of either TSC gene leads to increased mTORC1 but decreased mTORC2 signaling. As the contribution of decreased mTORC2 signaling to neural development and homeostasis has not been well studied, we generated a conditional knockout (CKO) of Rictor, a key component of mTORC2. mTORC2 signaling is impaired in the brain, whereas mTORC1 signaling is unchanged. Rictor CKO mice have small brains and bodies, normal lifespan and are fertile. Cortical layering is normal, but neurons are smaller than those in control brains. Seizures were not observed, although excessive slow activity was seen on electroencephalography. Rictor CKO mice are hyperactive and have reduced anxiety-like behavior. Finally, there is decreased white matter and increased levels of monoamine neurotransmitters in the cerebral cortex. Loss of mTORC2 signaling in the cortex independent of mTORC1 can disrupt normal brain development and function and may contribute to some of the neurologic manifestations seen in TSC.


Figures

Figure 1.
Figure 1.
Rictor CKO mice have decreased mTORC2 signaling with decreased brain and body weight. (A) Representative immunoblots of control (con) versus Rictor CKO dorsal cortex extracts. (B) Significant decreases in Rictor, phosphorylated Akt at both serine 473 and threonine 308 residues and the indirect mTORC2 target pNDRG1 from dorsal brain extracts of Rictor CKO mice when compared with littermate controls. mTORC1 signaling as indicated by levels of phosphorylated S6 (Serine 235/236) is not different. Asterisks denote statistical significance using Student's t-test; P < 0.02 for Rictor, P = 0.0005 for pAkt (S473), P = 0.011 for pAkt (T308) and P = 0.04 for pNDRG1 (T346). (n = 3 animals per group). (C, D) Decreased body size in male and female Rictor CKO mice when compared with age-matched controls. Asterisks denote statistical significance using 2-way ANOVA with Bonferroni post-test; P < 0.05. (n = 9–12 animals per group). (E) Decreased brain weight in P15 Rictor CKO mice (n = 18) when compared with littermate controls (n = 38). Asterisks denote statistical significance using Student's t-test, P < 0.0001. (F) Brain/body weight ratio in Rictor CKO mice (n = 18) is not different when compared with littermate controls (n = 38). Statistical significance was determined using Student's t-test.
Figure 2.
Figure 2.
Normal thickness of the cerebral cortex but decreased size of neurons in Rictor CKO brain. (A–C) Layer II-IV thickness was identified by staining with the upper layer marker Cux1 and was not significantly different between (A) control (n = 5) and (B) CKO cortex (n = 5). Scale bars, 200 µm. Data were expressed as mean ± SEM and compared using Student's t-test. (D and E) Upper layer neurons in layer II–IV were identified by double labeling with Cux1 and the neuronal marker NeuN. Scale bars, 50 µm. The area of Cux1/NeuN double-positive cells was decreased in Rictor CKO cortex when compared with littermate controls. Data were expressed as mean ± SEM, >40 cells per animal, n = 5 animals per group. Asterisks denote statistical significance using Student's t-test, P = 0.0011.
Figure 3.
Figure 3.
Slowing of background EEG activity in Rictor-deficient cortex. (A) Representative EEG epoch from P15 control and Rictor CKO mice, the relative proportions of delta (0.5–3 Hz), theta (4–7 Hz), alpha (8–12 Hz) and beta (13–30 Hz) frequency bands are shown. (B) Spectral analyses of delta, theta, alpha and beta frequency bands revealed significantly increased power in the delta and theta frequency bands relative to the beta band in Rictor CKO animals (n = 4) in comparison to littermate controls (n = 4). Asterisk denotes statistical significance using Student's t-test, P < 0.05.
Figure 4.
Figure 4.
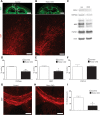
Myelination is abnormal in Rictor-deficient cortex with decreased expression of myelin-associated proteins. (A, B) Decreased expression of MBP in neuronal processes in Rictor CKO when compared with age-matched control mice. Low-power inset marked with asterisk denotes location from where images were obtained (Inset scale bar 1 mm). (C–F) Levels of the myelin components CNPase (D) and MBP (E) are significantly reduced in Rictor CKO (n = 3) cortex versus littermate controls (n = 3), whereas levels of the axonal marker PGP9.5 (F) are unchanged. Data expressed as mean ± SEM. Single and double asterisks denote statistical significance using Student's t-test, P < 0.03 and P < 0.005, respectively. Corpus callosum thickness is reduced in the Rictor CKO when compared with littermate control. Low-power inset in (A) marked with pound sign denotes location from which images were obtained. The corpus callosum was readily visualized with MBP staining and its width measured in Rictor CKO (H) (n = 7) and littermate control mice (G) (n = 7) at P15. (I) Data were expressed as mean ± SEM. Asterisk denotes statistical significance using Student's t-test, P < 0.01. Scale bars, 100 µm.
Figure 5.
Figure 5.
Rictor CKO animals have increased locomotor activity and novelty-induced insomnia. (A) Increased horizontal movements of Rictor CKO (n = 16) when compared with littermate control mice (n = 20) measured during open field testing in a novel environment. Data were expressed as mean ± SEM. Statistical significance was determined using 2-way ANOVA, *P < 0.01, **P < 0.003. (B) Persistently increased activity of Rictor CKO (n = 8) mice when compared with littermate controls (n = 8) on day 15 following 14 days of acclimation to the testing chamber. Data expressed as mean ± SEM. Asterisks denote statistical significance using Student's t-test, P < 0.0001.
Figure 6.
Figure 6.
Rictor CKO animals have decreased anxiety-like behaviors. Open quadrant distance (A) and time spent in the open arm (B) were significantly elevated in Rictor CKO animals (n = 8 males, 9 females) when compared with littermate controls (n = 8 males, 11 females). Asterisk denotes statistical significance using 1-way analysis of variance, P < 0.05. (C) Rictor CKO animals (n = 8) displayed significantly less running wheel activity when compared with littermate controls (n = 8). Asterisk denotes statistical significance using Student's t-test, P < 0.05. (D) Marble-burying activity was reduced in Rictor CKO animals (n = 17) when compared with littermate controls (n = 20). Asterisk denotes statistical significance using Student's t-test, P < 0.0001. All data were expressed as mean ± SEM.
Figure 7.
Figure 7.
Monoamine levels are increased in Rictor CKO frontal cortex. Monoamine levels were significantly elevated in dorsal frontal cortex from Rictor CKO mice (n = 3) versus littermate controls (n = 6). Data were expressed as mean ± SEM. Asterisk denotes statistical significance using Student's t-test, P < 0.05.

References

    1. Kim D.H., Sarbassov D.D., Ali S.M., King J.E., Latek R.R., Erdjument-Bromage H., Tempst P., Sabatini D.M. mTOR interacts with raptor to form a nutrient-sensitive complex that signals to the cell growth machinery. Cell. 2002;110:163–175. doi:10.1016/S0092-8674(02)00808-5. - DOI - PubMed
    1. Liu L.H., Das S., Losert W., Parent C.A. mTORC2 regulates neutrophil chemotaxis in a cAMP- and RhoA-dependent fashion. Dev. Cell. 2010;19:845–857. doi:10.1016/j.devcel.2010.11.004. - DOI - PMC - PubMed
    1. Fingar D.C., Richardson C.J., Tee A.R., Cheatham L., Tsou C., Blenis J. mTOR controls cell cycle progression through its cell growth effectors S6K1 and 4E-BP1/eukaryotic translation initiation factor 4E. Mol. Cell Biol. 2004;24:200–216. doi:10.1128/MCB.24.1.200-216.2004. - DOI - PMC - PubMed
    1. Hay N., Sonenberg N. Upstream and downstream of mTOR. Genes Dev. 2004;18:1926–1945. doi:10.1101/gad.1212704. - DOI - PubMed
    1. Sarbassov D.D., Ali S.M., Sengupta S., Sheen J.H., Hsu P.P., Bagley A.F., Markhard A.L., Sabatini D.M. Prolonged rapamycin treatment inhibits mTORC2 assembly and Akt/PKB. Mol. Cell. 2006;22:159–168. doi:10.1016/j.molcel.2006.03.029. - DOI - PubMed

Publication types

Substances