. 2012;7(9):e45001.
doi: 10.1371/journal.pone.0045001. Epub 2012 Sep 26.

The adult cystic fibrosis airway microbiota is stable over time and infection type, and highly resilient to antibiotic treatment of exacerbations

Affiliations

The adult cystic fibrosis airway microbiota is stable over time and infection type, and highly resilient to antibiotic treatment of exacerbations

Anthony A Fodor et al. PLoS One. 2012.

Abstract

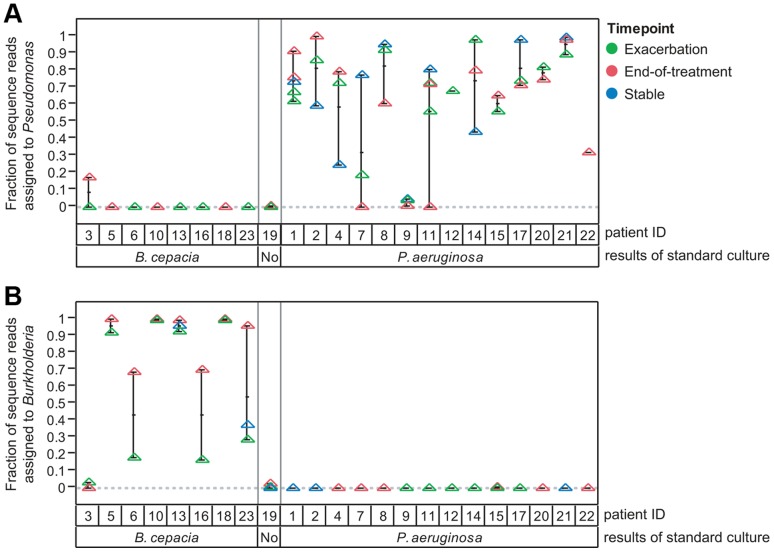
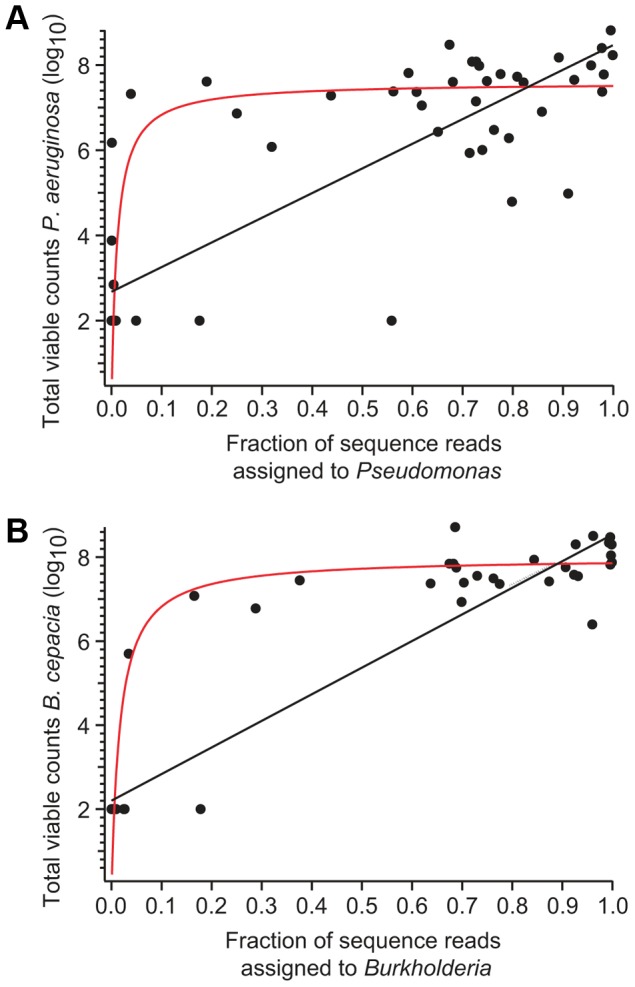
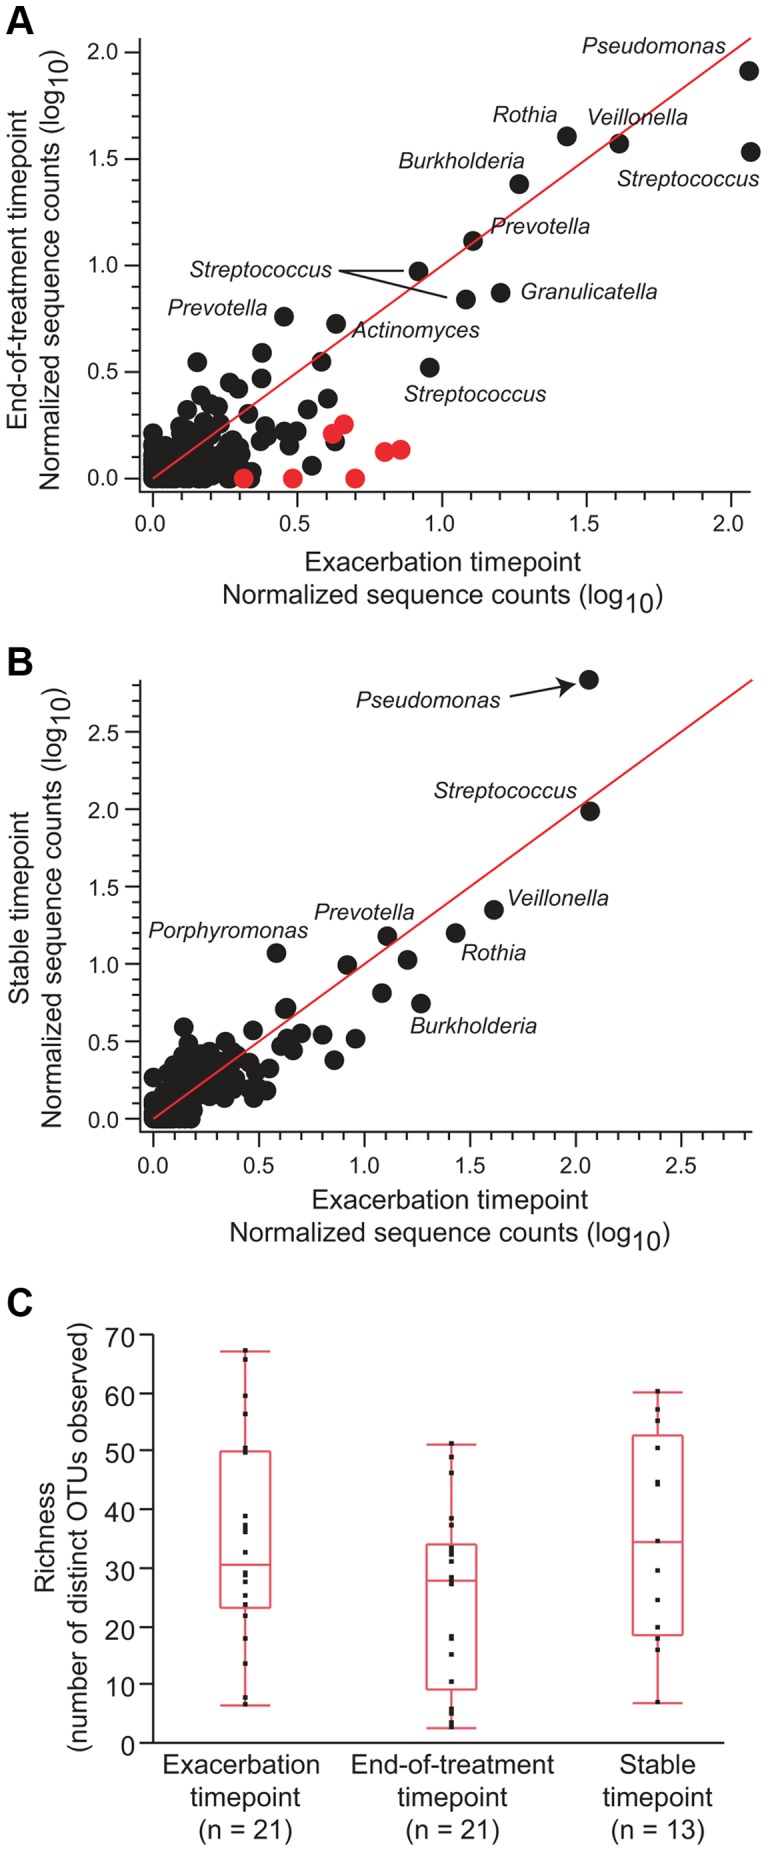
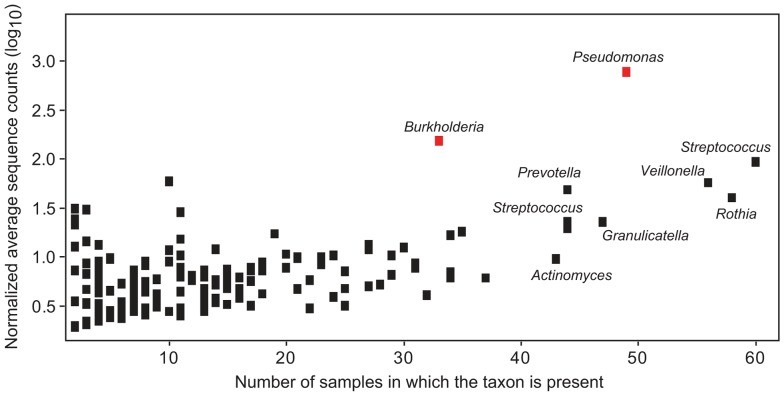
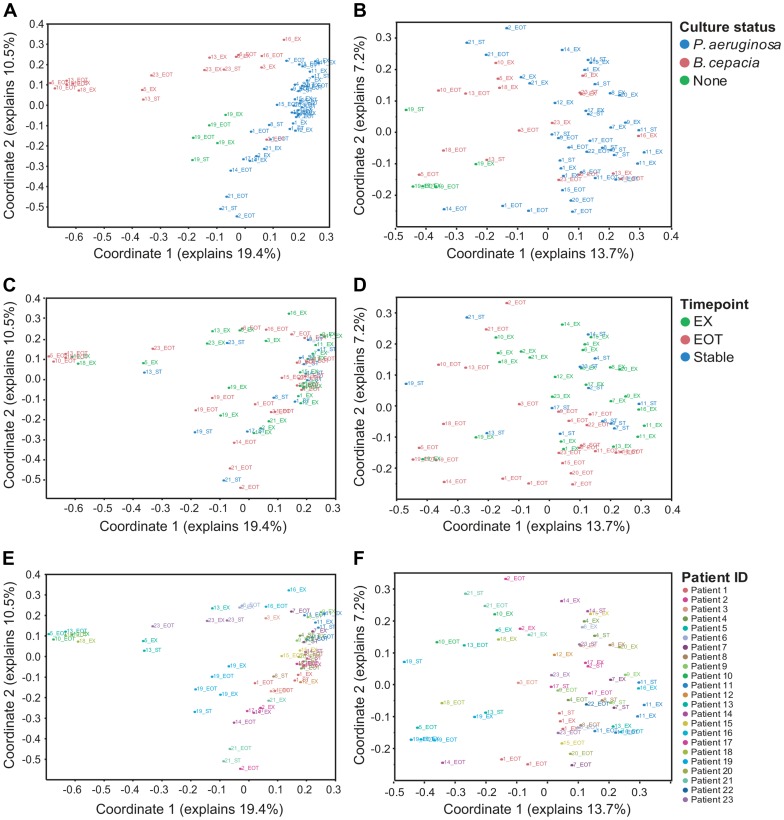
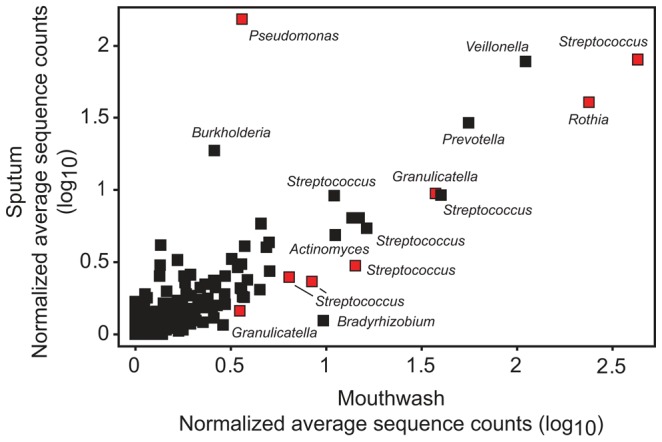
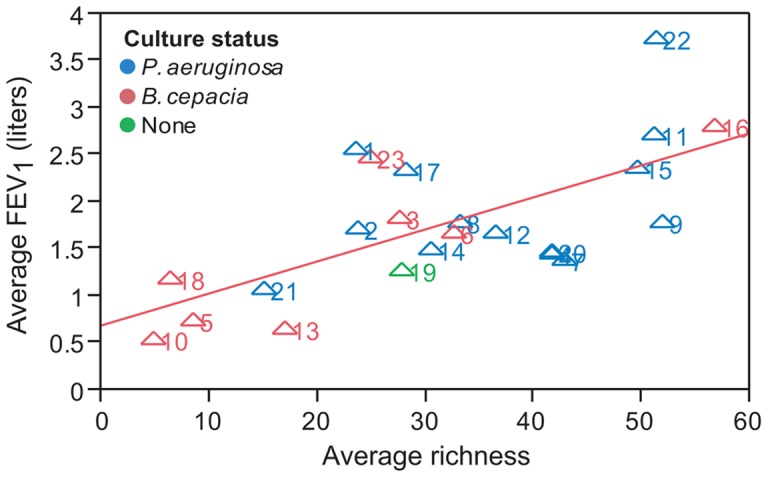
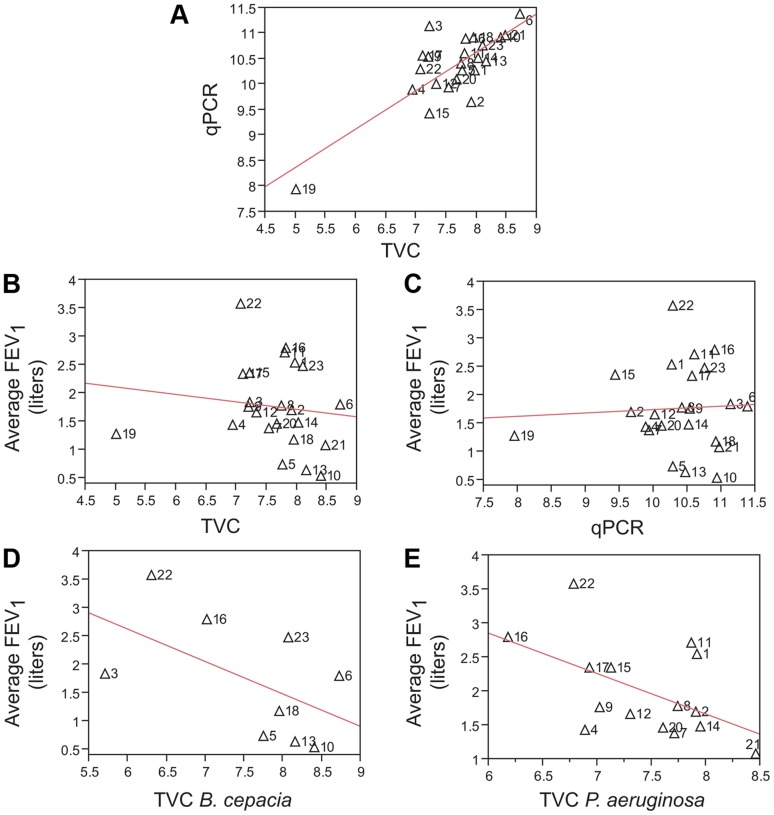
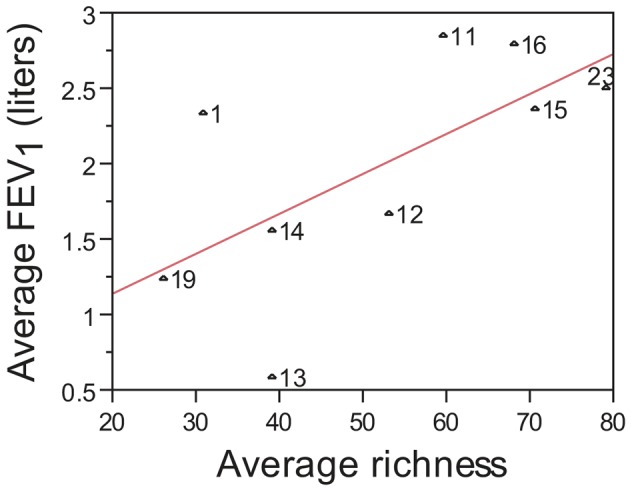
Cystic fibrosis (CF) is characterized by defective mucociliary clearance and chronic airway infection by a complex microbiota. Infection, persistent inflammation and periodic episodes of acute pulmonary exacerbation contribute to an irreversible decline in CF lung function. While the factors leading to acute exacerbations are poorly understood, antibiotic treatment can temporarily resolve pulmonary symptoms and partially restore lung function. Previous studies indicated that exacerbations may be associated with changes in microbial densities and the acquisition of new microbial species. Given the complexity of the CF microbiota, we applied massively parallel pyrosequencing to identify changes in airway microbial community structure in 23 adult CF patients during acute pulmonary exacerbation, after antibiotic treatment and during periods of stable disease. Over 350,000 sequences were generated, representing nearly 170 distinct microbial taxa. Approximately 60% of sequences obtained were from the recognized CF pathogens Pseudomonas and Burkholderia, which were detected in largely non-overlapping patient subsets. In contrast, other taxa including Prevotella, Streptococcus, Rothia and Veillonella were abundant in nearly all patient samples. Although antibiotic treatment was associated with a small decrease in species richness, there was minimal change in overall microbial community structure. Furthermore, microbial community composition was highly similar in patients during an exacerbation and when clinically stable, suggesting that exacerbations may represent intrapulmonary spread of infection rather than a change in microbial community composition. Mouthwash samples, obtained from a subset of patients, showed a nearly identical distribution of taxa as expectorated sputum, indicating that aspiration may contribute to colonization of the lower airways. Finally, we observed a strong correlation between low species richness and poor lung function. Taken together, these results indicate that the adult CF lung microbiome is largely stable through periods of exacerbation and antibiotic treatment and that short-term compositional changes in the airway microbiota do not account for CF pulmonary exacerbations.


Conflict of interest statement

Competing Interests: The authors have declared that no competing interests exist.

Figures

Figure 1
Figure 1. The CF microbiome consists primarily of previously identified bacterial taxa.
Each consensus OTU identified within the CF sample set was aligned to version 104 of the SILVA database of bacterial 16S rRNA gene sequences using the program align.seqs in the software package Mothur as described in Methods. The percent identity of the resulting global alignment is shown as a function of the number of sequences in each OTU. The red line represents 97% identity.
Figure 2
Figure 2. CF is a polymicrobial disease.
Phylogenetic tree of the 169 OTUs identified in the CF sputum dataset. Tree construction was achieved by mapping consensus sequences from each OTU to the SILVA reference tree (see Methods). Each leaf of the tree represents a consensus OTU labeled with the most closely related genus assigned by the RDP classifier.
Figure 3
Figure 3. There is broad agreement between qualitative bacterial culture results and 454 pyrosequencing for dominant CF pathogens.
The fraction of sequence assigned to the genus (a) Pseudomonas or (b) Burkholderia are plotted for each patient and sample timepoint as a function of the patient' s reported culture status for the recognized CF pathogens P. aeruginosa and B. cepacia complex species. Patient samples are color-coded by timepoint (green, onset of exacerbation; red, end-of-treatment for exacerbation with intravenous antibiotics; blue, clinically stable interval). Patient 19 was culture negative for both P. aeruginosa and B. cepacia.
Figure 4
Figure 4. Total viable counts by culture show significant but non-linear agreement with relative sequence abundance.
TVC for (a) P. aeruginosa and (b) B. cepacia complex species plotted against the fraction of sequences assigned to the corresponding genera in each sputum sample. Black lines represent linear regression by least squares fitting. Values for Pseudomonas (r2 = 0.71, p<0.001) and Burkholderia (r2 = 0.86, p<0.001) indicate a significant correlation. Red lines are intended to illustrate a potential non-linear relationship and are based on the two-parameter Michaelis-Menten function with arbitrarily selected parameters.
Figure 5
Figure 5. Abundance taxa are highly stable during exacerbation and in response to antibiotic treatment.
To determine whether the relative abundance of specific taxa changed during exacerbation or following antibiotic treatment, the normalized average sequence abundance for all detected OTUs was compared (a) between exacerbation (n = 22) and end-of-treatment timepoints (n = 22) and (b) between the exacerbation (n = 22) and stable timepoints (n = 13). For each taxon, normalized average sequence abundance values are plotted as a logarithm to the base 10 (log10). Red circles indicate taxa that had significantly lower normalized average sequence abundance following antibiotic treatment at a 10% false discovery rate. (c) Comparison of overall microbial richness at all three sampling timepoints indicates a slight, but transient decrease following antibiotic treatment. By pairwise t-tests, comparisons of richness between exacerbation and end-of-treatment (p = 0.06, n = 21), exacerbation and stable (p = 0.87, n = 13) and stable and end-of-treatment (p = 0.076, n = 13) timepoints all fail to reach statistical significance at a p≤0.05 threshold.
Figure 6
Figure 6. Prevalent taxa are also abundant taxa.
Plot showing the log transformed (log10) average normalized sequence counts for each taxon compared to the number of samples in which the taxon is present. Averaged values only include samples in which the taxon is present. Only taxa present in two or more samples (155 OTUs) are plotted. Raw data used to generate used for this analysis are available in Table S7. Red symbols indicate recognized dominant CF pathogens.
Figure 7
Figure 7. Sequence signatures discriminate between infection types, timepoint and individual patient.
A principal coordinates analysis (PCoA) of the sputum sample sequence data was performed using Bray-Curtis distance. (a, b) PCoA with samples color-coded by patient' s reported culture status for the recognized CF pathogens P. aeruginosa (blue), B. cepacia complex species (red) or those that were culture negative for both (green). (c, d) PCoA in which samples are color-coded by timepoint; onset of acute exacerbation (EX, green), end-of-treatment with antibiotics (EOT, red) or when clinically stable (blue). (e, f) PCoA with samples color-coded by individual patient ID. Each sample is indicated by a symbol labeled with patient ID and timepoint (EX, onset of exacerbation; EOT, end-of-treatment with intravenous antibiotics; ST, clinically stable interval). (a, c, e) PCoA includes all taxa that had at least 10 sequences in the dataset. (b, d, f) PCoA with all Pseudomonas and Burkholderia sequences removed from the dataset. Relative abundance data (Table S3) for each OTU were log-transformed and normalized before Bray-Curtis dissimilarities were calculated and analyzed using the PCoA algorithm in the program Mothur as described in the Methods.
Figure 8
Figure 8. Mouthwash and sputum samples have a highly similar distribution of taxa.
To determine whether oral flora contribute to CF airway microbial communities, we compared the normalized average sequence abundance of all OTUs found in 22 paired mouthwash and sputum samples from 9 patients. For each taxon, normalized average sequence abundance values are plotted as a logarithm to the base 10 (log10). Red symbols indicate taxa that had significantly different distribution between sample types at a 10% false discovery rate from a parametric t-test in which the 22 samples were treated as independent measurements.
Figure 9
Figure 9. Low species richness in sputum samples is associated with decreased lung function.
Shown is a plot of the average FEV1 compared to average microbial richness in sputum for each patient. FEV1 and microbial richness values were averaged across all timepoints for each patient. Numbers next to each symbol indicate patient ID. Symbols are color-coded based on patient culture status (P. aeruginosa, blue; B. cepacia complex species, red; culture negative for both, green). Results from linear regression analysis (red line) indicate a significant correlation (r2 = 0.42, p = 0.0009).
Figure 10
Figure 10. Lung function is not correlated with total bacterial abundance.
Measurements of total bacterial abundance in sputum by (a) TVC and qPCR are well correlated (r2 = 0.63, p<0.0001; n = 23). FEV1 is not correlated with (b) TVC (r2 = 0.017, p = 0.55; n = 23) or (c) qPCR (r2 = 0.003, p = 0.8; n = 23) and only modestly correlated with TVC from (d) B. cepacia complex species (r2 = 0.29, p = 0.13; n = 8) and (e) P. aeruginosa (r2 = 0.26, p = 0.05; n = 14). Measurements for bacterial abundance and FEV1 were averaged across timepoints for each of the 23 patients. Labels in each panel indicate patient ID. Lines indicate regression fit by linear least squares. Only TVC values >0 were included for B. cepacia and P. aeruginosa comparisons. TVC values represent log10 of total bacterial colony forming units (CFUs) recovered per gram of sputum. qPCR values represent log10 copies of the bacterial 16S rRNA gene detected per gram of sputum.
Figure 11
Figure 11. Low species richness in mouthwash samples is associated with decreased lung functions.
Shown is a plot of the average FEV1 compared to average microbial richness in mouthwash samples for nine patients. FEV1 and microbial richness values were averaged across all timepoints for each patient. Numbers next to each symbol indicate patient ID. Results from linear regression analysis (red line) showed a modest correlation with lung function (r2 = 0.42, p = 0.057).

Similar articles

Cited by

References

    1. Boyle MP (2007) Adult cystic fibrosis. JAMA 298: 1787–1793. - PubMed
    1. Dodge JA, Lewis PA, Stanton M, Wilsher J (2007) Cystic fibrosis mortality and survival in the UK: 1947–2003. Eur Respir J 29: 522–526. - PubMed
    1. Hodson ME, Simmonds NJ, Warwick WJ, Tullis E, Castellani C, et al. (2008) An international/multicentre report on patients with cystic fibrosis (CF) over the age of 40 years. J Cyst Fibros 7: 537–542. - PubMed
    1. Vandenbranden SL, McMullen A, Schechter MS, Pasta DJ, Michaelis RL, et al. (2012) Lung function decline from adolescence to young adulthood in cystic fibrosis. Pediatr Pulmonol 47: 135–143. - PMC - PubMed
    1. Razvi S, Quittell L, Sewall A, Quinton H, Marshall B, et al. (2009) Respiratory microbiology of patients with cystic fibrosis in the United States, 1995 to 2005. Chest 136: 1554–1560. - PubMed

Publication types

MeSH terms