. 2012;7(9):e45387.
doi: 10.1371/journal.pone.0045387. Epub 2012 Sep 26.

Phosphorylation of mouse melanopsin by protein kinase A

Affiliations

Phosphorylation of mouse melanopsin by protein kinase A

Joseph R Blasic Jr et al. PLoS One. 2012.

Abstract

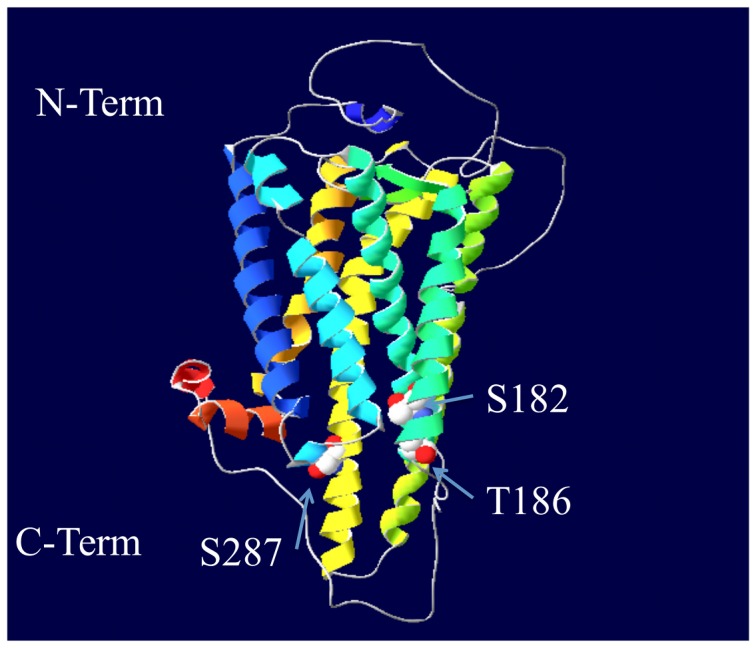
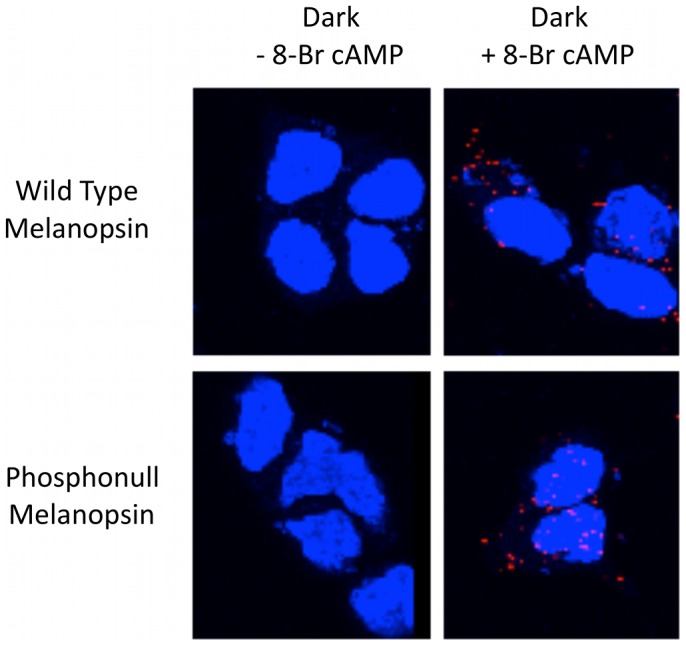
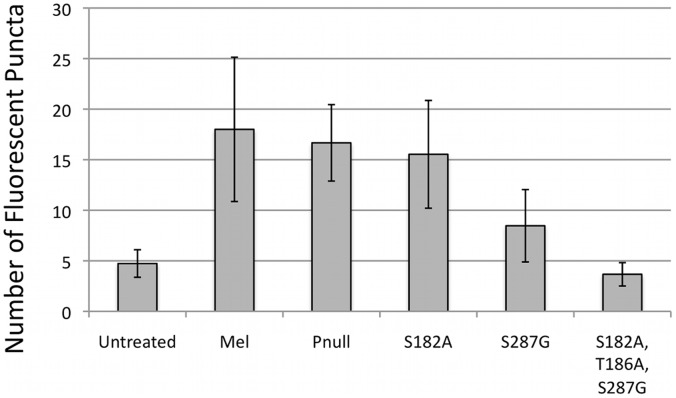
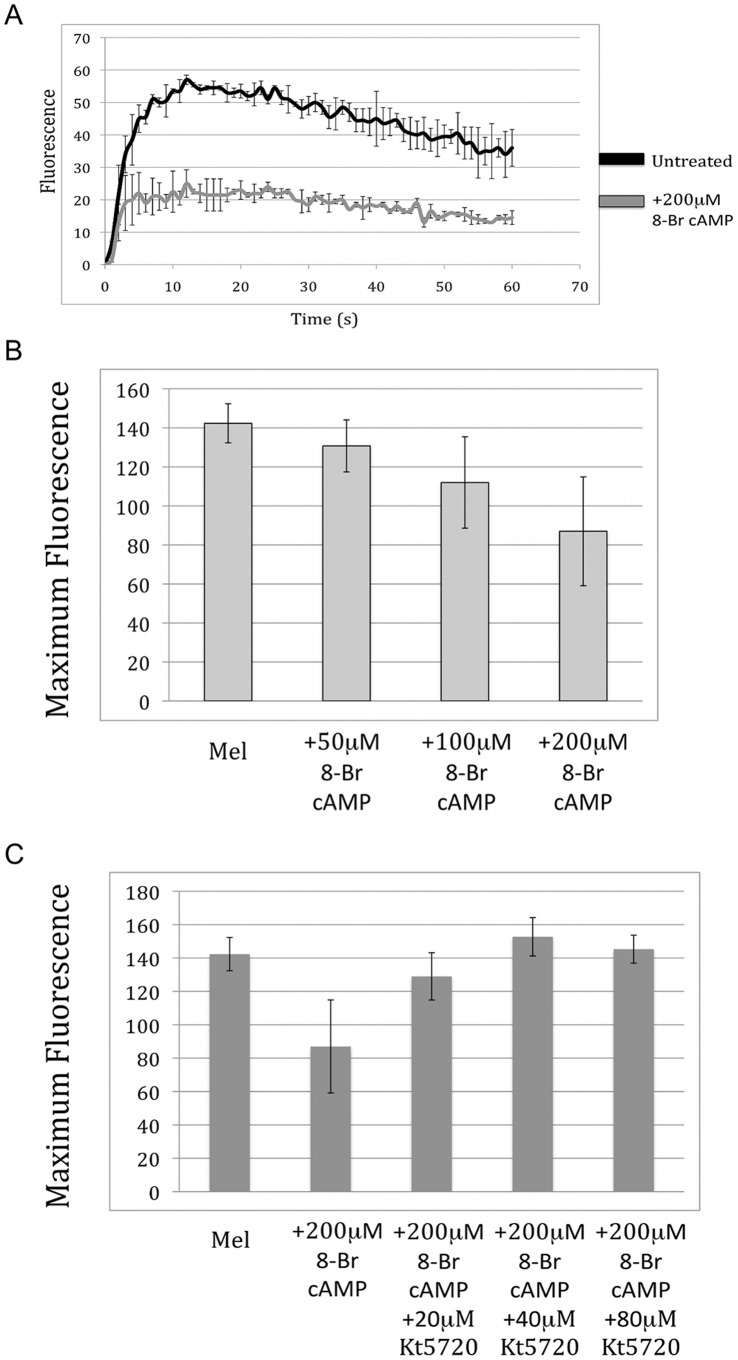
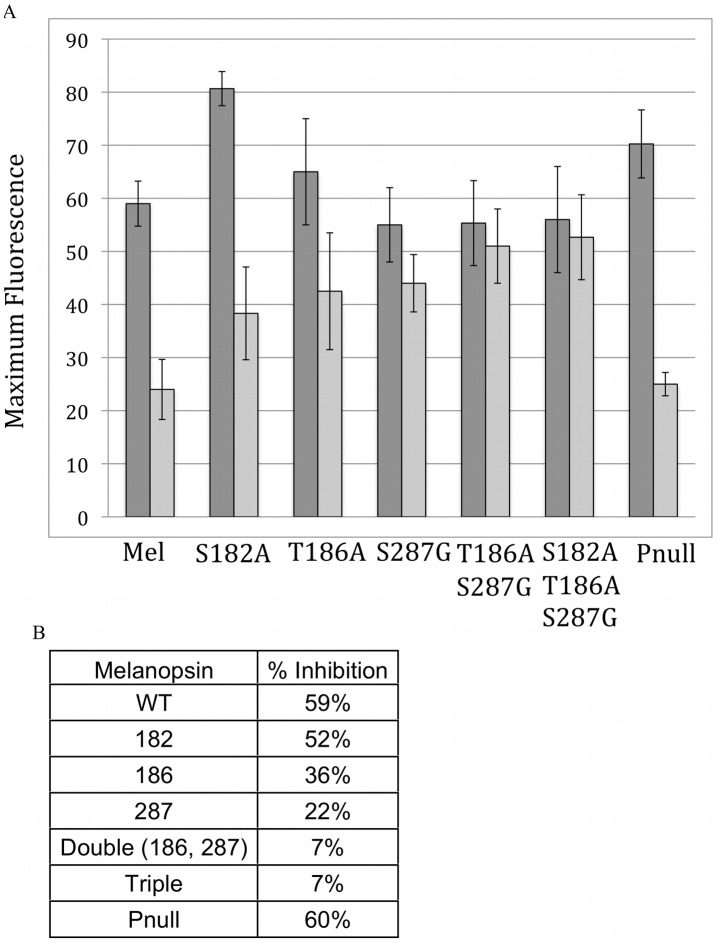
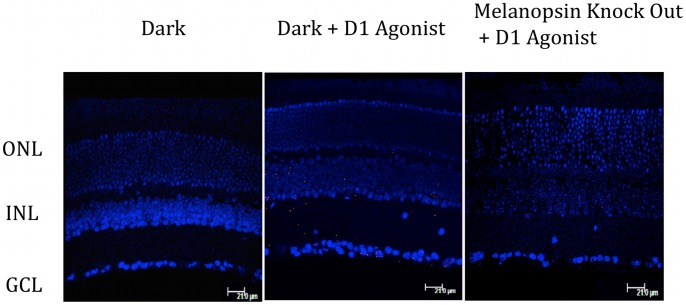
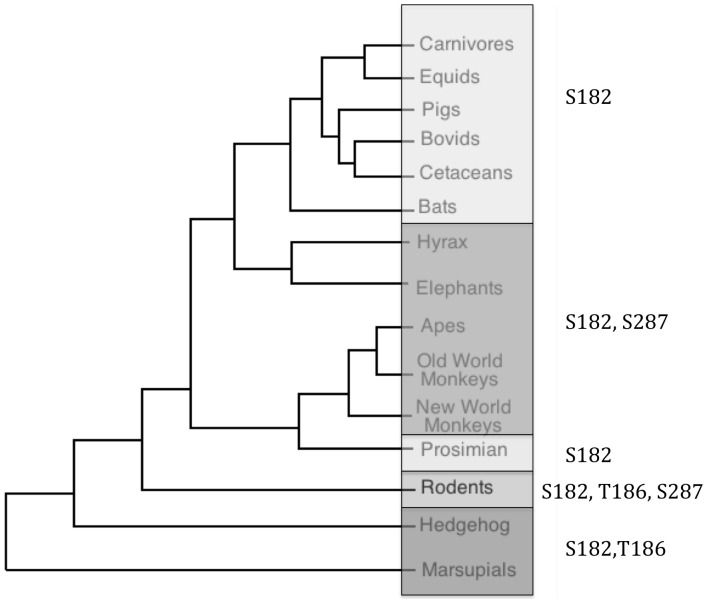
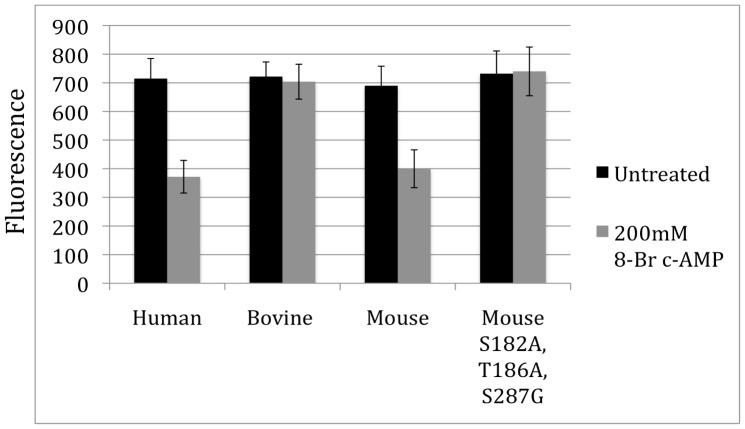
The visual pigment melanopsin is expressed in intrinsically photosensitive retinal ganglion cells (ipRGCs) in the mammalian retina, where it is involved in non-image forming light responses including circadian photoentrainment, pupil constriction, suppression of pineal melatonin synthesis, and direct photic regulation of sleep. It has recently been shown that the melanopsin-based light response in ipRGCs is attenuated by the neurotransmitter dopamine. Here, we use a heterologous expression system to demonstrate that mouse melanopsin can be phosphorylated by protein kinase A, and that phosphorylation can inhibit melanopsin signaling in HEK cells. Site-directed mutagenesis experiments revealed that this inhibitory effect is primarily mediated by phosphorylation of sites T186 and S287 located in the second and third intracellular loops of melanopsin, respectively. Furthermore, we show that this phosphorylation can occur in vivo using an in situ proximity-dependent ligation assay (PLA). Based on these data, we suggest that the attenuation of the melanopsin-based light response by dopamine is mediated by direct PKA phosphorylation of melanopsin, rather than phosphorylation of a downstream component of the signaling cascade.


Conflict of interest statement

Competing Interests: The authors have declared that no competing interests exist.

Figures

Figure 1
Figure 1. 3-dimenstional model of mouse melanopsin highlighting the predicted PKA phosphorylation sites found in intracellular loops.
The sites in the C-tail are not depicted. Model constructed by LOMETS modeling server, and sites identified by Group-based Prediction System (GPS 2.0) .
Figure 2
Figure 2. Proximity-dependent ligation assay.
Melanopsin-transfected HEK cells were fixed with 4% PFA for 30 min. with or without pretreatment with 200 µM 8-Br cAMP for 30 minutes before fixation. Melanopsin phosphorylation was assayed with the PLA as described in Materials and Methods. The red fluorescence puncta indicates that the antibody bound to melanopsin’s intracellular C-terminal domain is within 40 nm of the phospho-serine antibody when bound to phosphorylation sites in the intracellular loops. Cells visualized by confocal microscopy. Blue staining indicates DAPI staining of cell nuclei. Images represent Z-stacks of images taken through entire cell.
Figure 3
Figure 3. Quantification of the number of fluorescent puncta per cell induced by 8-Br cAMP treatment.
HEK cells were transfected with wild type or mutant melanopsin. After 48-hours, cells were treated with 200 µM 8-Br cAMP for 30-minutes, fixed in 4% PFA for 30 minutes, and assayed with the PLA. Cells were imaged by confocal microscopy and the number of fluorescent spots per cell were counted. Expression of melanopsin was confirmed by functional calcium assay. Error bars represent standard deviation of 50 cells counted for each condition pooled from two separate transfections.
Figure 4
Figure 4. Effect of 8-Br cAMP on light induced calcium mobilization in melanopsin-transfected cells.
A) Time course of the calcium response of HEK-293 cells in the presence and absence of 8-Br cAMP. HEK-293 cells were transiently transfected with DNA for wild-type melanopsin. Some cells were treated with 200 µM 8-Br cAMP. Melanopsin signaling was monitored by measuring intracellular calcium levels as described in Methods. B) HEK-293 cells transfected with melanopsin were treated with varying concentrations of 8-Br cAMP to show a concentration dependent decrease in melanopsin signaling. The peak response of the time course is plotted. C) Pre-treatment of transfected cells with the specific PKA inhibitor KT5720 removed the effect of 8-Br cAMP treatment also in a concentration dependent manner. Error bars represent standard deviation.
Figure 5
Figure 5. Effect of 8-Br cAMP on mutant and wild type melanopsin calcium signaling.
A) Graph of the peak calcium response of melanopsin and melanopsin mutants as measured by fluorescent calcium assay. In black is the average maximum fluorescence for untreated cells, while 200 µM 8-Br cAMP treated response is shown in grey. Error bars represent standard deviation. B) The average percent 8-Br cAMP induced inhibition in signaling is shown.
Figure 6
Figure 6. Dopamine agonist induces phosphorylation in vivo.
PLA was performed on mouse retinal section following treatment with the D1 agonist A68930. Retinal sections (16 mm) were taken from dark-adapted wild type C57/B6 mice (panels labeled Dark, or Dark + D1 agonist) or dark-adapted melanopsin knockout mice (opn4 LacZ/LacZ) (panel labeled Melanopsin knock out + D1 agonisit). Before fixation retina were treated with the dopamine D1 agonist A68930 (labled +D1 agonist) or left untreated (Dark). Outer nuclear layer (ONL): Inner nuclear layer (INL) and Ganglion cell layer (GCL).
Figure 7
Figure 7. Modified mammalian tree highlighting presence of putative homologous PKA phosphorylation sites.
Tree based on (Tree of Life Web Project. 1997. Eutheria. Placental Mammals. Version 01 January 1997 http://tolweb.org/Eutheria/15997/1997.01.01 in The Tree of Life Web Project,http://tolweb.org/ ). Conserved PKA phosphorylation sites are indicated on the right.
Figure 8
Figure 8. Functional consequences of natural variation in PKA phosphorylation sites.
Graph of the peak calcium response of human, bovine, mouse melanopsin and the mouse melanopsin mutant (S182A,T186A, S287G) as measured by the fluorescent calcium assay. In black is the average maximum fluorescence for untreated cells, while 200 µM 8-Br cAMP treated response is shown in grey. Error bars represent standard deviation.

References

    1. Altimus CM, Güler AD, Villa KL, McNeill DS, Legates TA, et al. (2008) Rods-cones and melanopsin detect light and dark to modulate sleep independent of image formation. Proc Natl Acad Sci U S A 105: 19998–20003. - PMC - PubMed
    1. Hattar S, Kumar M, Park A, Tong P, Tung J, et al. (2006) Central projections of melanopsin-expressing retinal ganglion cells in the mouse. J Comp Neurol 497: 326–349. - PMC - PubMed
    1. Gooley JJ, Lu J, Fischer D, Saper CB (2003) A broad role for melanopsin in nonvisual photoreception. J Neurosci 23: 7093–7106. - PMC - PubMed
    1. Lupi D, Oster H, Thompson S, Foster RG (2008) The acute light-induction of sleep is mediated by OPN4-based photoreception. Nat Neurosci 11: 1068–1073. - PubMed
    1. Graham DM, Wong KY, Shapiro P, Frederick C, Pattabiraman K, et al. (2008) Melanopsin ganglion cells use a membrane-associated rhabdomeric phototransduction cascade. J Neurophysiol 99: 2522–2532. - PubMed

Publication types

MeSH terms