. 2012;7(9):e45655.
doi: 10.1371/journal.pone.0045655. Epub 2012 Sep 25.

A systematic investigation of differential effects of cell culture substrates on the extent of artifacts in single-molecule tracking

Affiliations

A systematic investigation of differential effects of cell culture substrates on the extent of artifacts in single-molecule tracking

Laura C Zanetti-Domingues et al. PLoS One. 2012.

Abstract

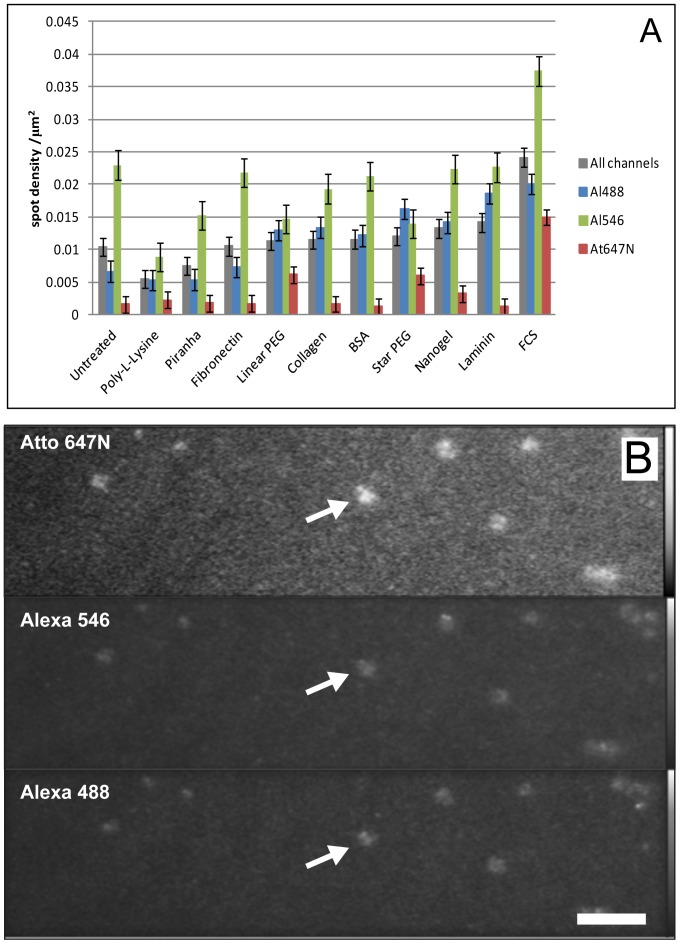
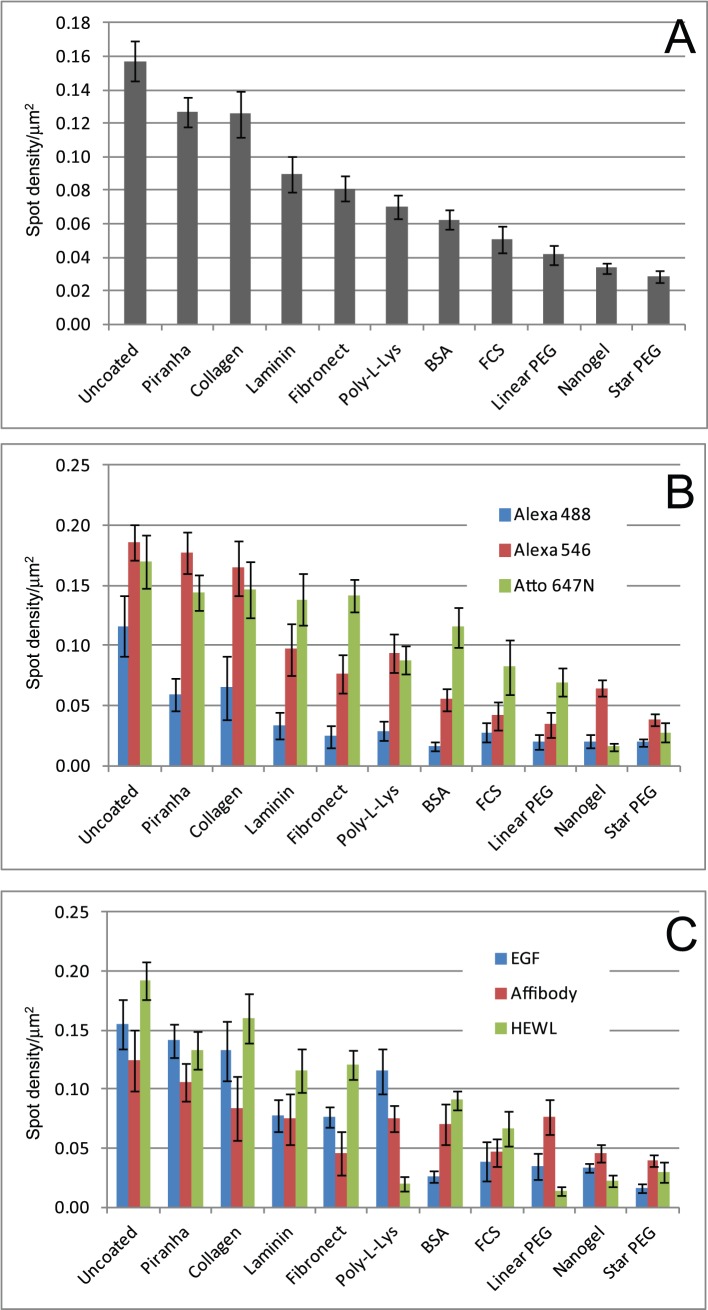
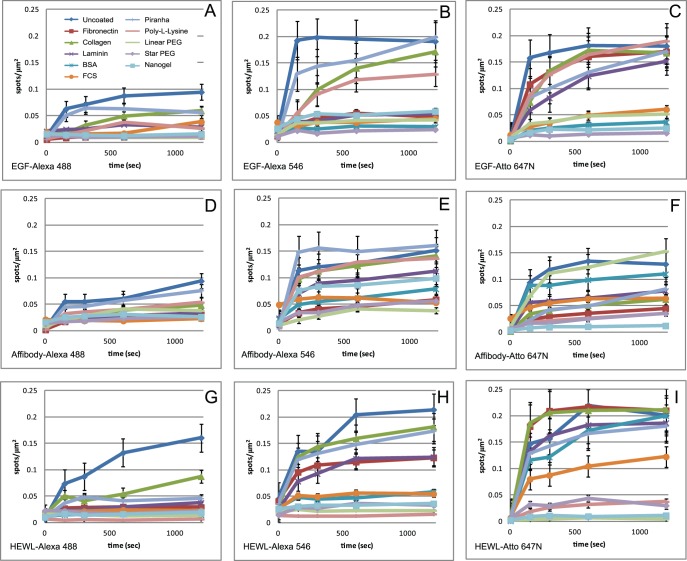
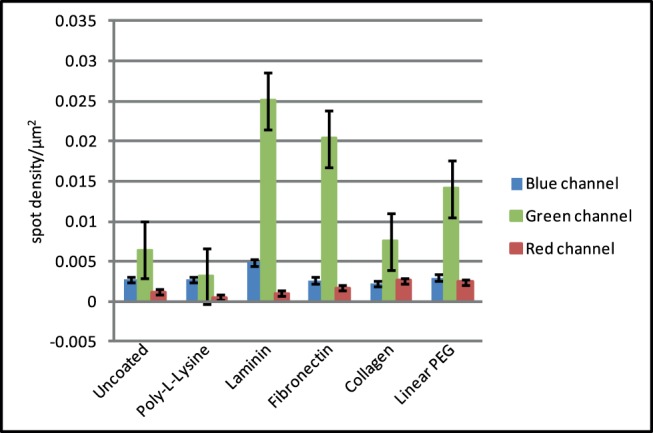
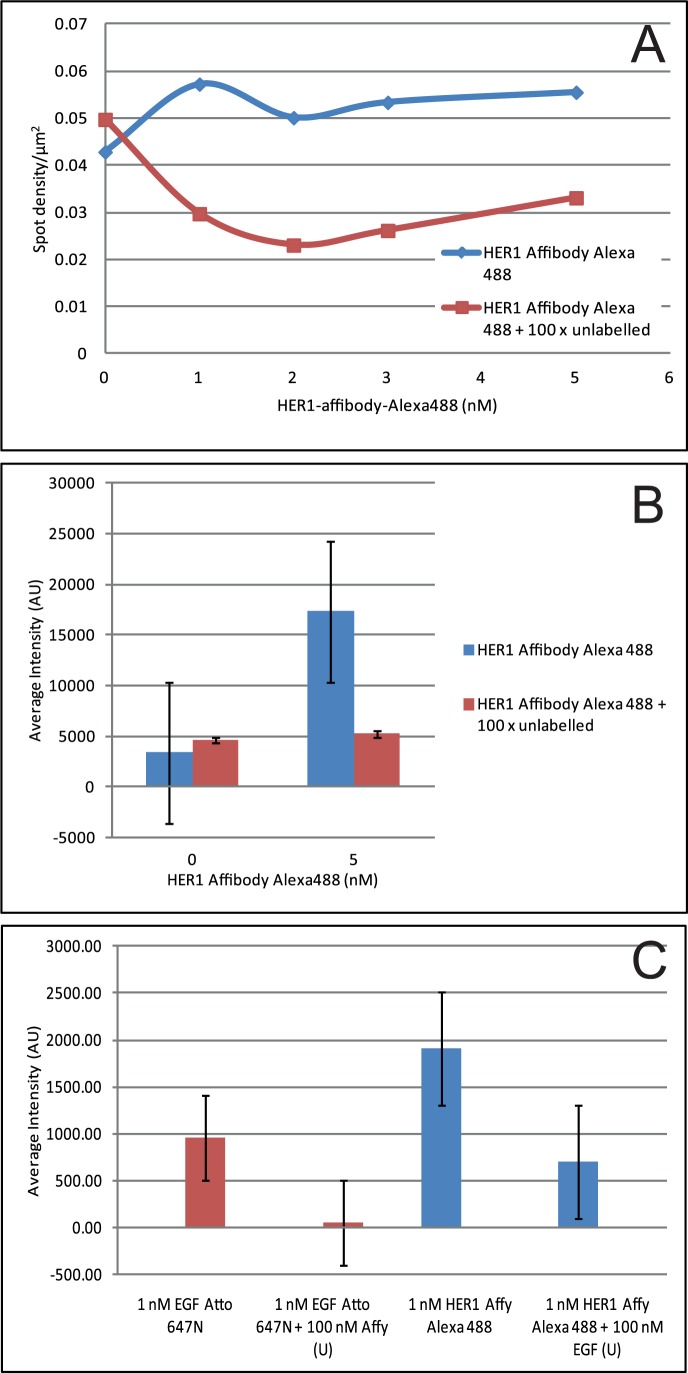
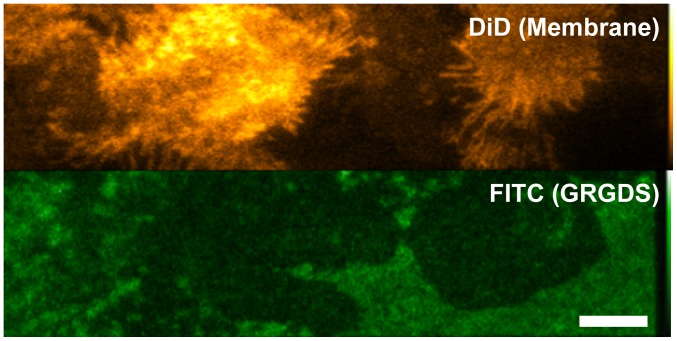
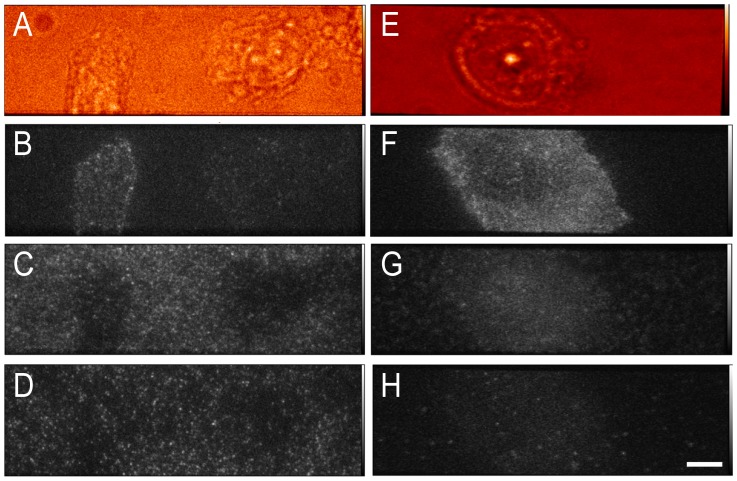
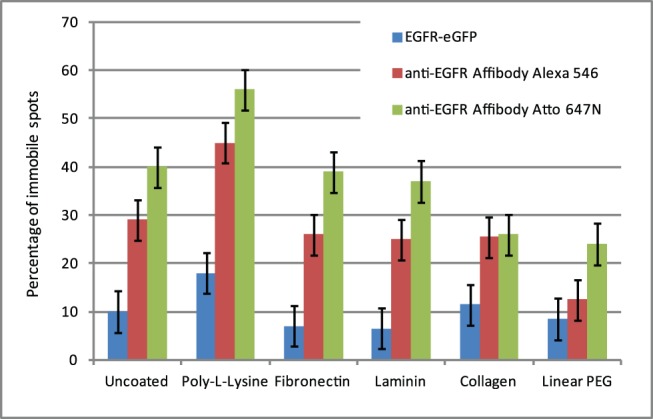
Single-molecule techniques are being increasingly applied to biomedical investigation, notwithstanding the numerous challenges they pose in terms of signal-to-noise ratio issues. Non-specific binding of probes to glass substrates, in particular, can produce experimental artifacts due to spurious molecules on glass, which can be particularly deleterious in live-cell tracking experiments. In order to resolve the issue of non-specific probe binding to substrates, we performed systematic testing of a range of available surface coatings, using three different proteins, and then extended our assessment to the ability of these coatings to foster cell growth and retain non-adhesive properties. Linear PEG, a passivating agent commonly used both in immobilized-molecule single-molecule techniques and in tissue engineering, is able to both successfully repel non-specific adhesion of fluorescent probes and to foster cell growth when functionalized with appropriate adhesive peptides. Linear PEG treatment results in a significant reduction of tracking artifacts in EGFR tracking with Affibody ligands on a cell line expressing EGFR-eGFP. The findings reported herein could be beneficial to a large number of experimental situations where single-molecule or single-particle precision is required.


Conflict of interest statement

Competing Interests: The authors have declared that no competing interests exist.

Figures

Figure 1
Figure 1. Background fluorescence of treated surfaces.
A) Mean spot density/µm2 histograms for each surface treatment before exposure to fluorescently-labelled protein (grey columns represent the average calculated on all three channels - each data point corresponds to mean ± SEM from 135 areas, coloured columns represent the averages for each single channel – each data point corresponds to mean ± SEM from 45 areas). B) TIRF fluorescence image of star PEG-treated dish, showing patches of background fluorescence in all detection channels (example arrowed) (bar 8 µm).
Figure 2
Figure 2. Fluorescent spot densities of treated surfaces after exposure to labelled proteins.
A) Histogram showing average spot densities/µm2 for each surface treatment, after incubation with fluorescently-labelled proteins for 1200 seconds. Each data point corresponds to mean ± SEM from 135 areas, data from all protein-fluorophore combinations being averaged for each treatment. B) Average spot densities/µm2 for each fluorophore (each data point corresponds to mean ± SEM from 45 areas, 3 different proteins). c) Average spot densities/µm2 for each protein, each data point corresponds to mean ± SEM from 45 areas, 3 different fluorophores).
Figure 3
Figure 3. Fluorescent spot density/µm2 plots for treated surfaces exposed to the following labelled proteins.
A) EGF-Alexa 488, B) EGF-Alexa 546, C) EGF-Atto 647N, D) anti-HER2 Affibody-Alexa 488, E) anti-HER2 Affibody -Alexa 546, F) anti-HER2 Affibody -Atto 647N, G) HEWL C-Alexa 488, H) HEWL C -Alexa 546 and I) HEWL C -Atto 647N, incubated on differently coated glass surfaces for 150, 300, 600 and 1200 seconds at room temperature. Each datapoint corresponds to mean ± SEM of 15 areas acquired from 3 independent samples.
Figure 4
Figure 4. Mean spot density/µm2 histograms of background fluorescence of wt Cho cells seeded on different substrates (each data point corresponds to mean ± SEM from at least 15 areas).
Figure 5
Figure 5. Determination of level of non-specific binding of labelled proteins to cells.
A) Spot density/µm2 plot for HER1 Affibody Alexa488 on T47D cells in presence (red) or absence (blue) of 100x excess unlabelled HER1 Affibody as determined by fluorescent single-molecule detection. B) Average intensity histogram of HER1 Affibody Alexa488 on A431 cells in presence (red) or absence (blue) of 100x excess unlabelled HER1 Affibody as determined by confocal imaging. C) Average intensity histogram of HER1 Affibody Alexa488 (blue) and EGF Atto 647N (red) on A431 cells in presence or absence of 100x excess unlabelled competitor.
Figure 6
Figure 6. TIRF image of PEG-treated glass doped with fluorescent GRGDS peptide and T47D cells treated with DiD membrane probe to highlight membrane protrusions and membrane-glass contact areas (bar 8 µm).
Figure 7
Figure 7. Representative images of cells exposed to labelled proteins.
Panel A–D: representative images of CHO-EGFR-eGFP cells grown on uncoated glass. Whitelight (A), anti-EGFR Affibody Atto 647N (B), anti-EGFR Affibody Alexa 546 (C), and EGFR-eGFP (D). Panels E–H: representative images of CHO-EGFR-eGFP cells grown on linear-PEG +0.4 mM GRGDS peptide-coated glass. Whitelight (E), Anti-EGFR Affibody Atto 647N (F), anti-EGFR Affibody Alexa 546 (G), and EGFR-eGFP (H) (bar 8 µm).
Figure 8
Figure 8. Histogram showing percentage of tracks with diffusion coefficient falling in the D = 0 bin of the D distribution histogram in the three acquisition channels on CHO-EGFR-eGFP cells grown on differently coated glass surfaces and labelled with anti-EGFR Affibody Alexa 546 and Atto 647N for 15 minutes at 37°C.
Each datapoint corresponds to mean ± SEM of 15 areas acquired from 3 independent samples.
Figure 9
Figure 9. Side-by-side comparison of mean squared displacement (MSD) curves and diffusion coefficient (D) histograms from CHO-EGFR-eGFP cells grown on uncoated glass vs. linear-PEG+0.4 mM GRGDS-coated glass.
Data were plotted from at least 15 areas acquired from 3 independent samples. Each MSD value comes from at least 6500 (ranging up to 300,000) individual separations, resulting in very small standard error in the MSD. Error bars are plotted but too small to be visible. Panels A (uncoated) and B (linear PEG + GRGDS): diffusion coefficient histogram of tracked spots. EGFR-eGFP (red), anti-EGFR Affibody Alexa 546 (magenta), anti-EGFR Affibody Atto 647N (green). Dotted lines show the mean D coefficient extrapolation. Panels C (uncoated) and D (linear PEG + GRGDS): Mean Square displacement plot. EGFR-eGFP (red), anti-EGFR Affibody Alexa 546 (magenta), anti-EGFR Affibody Atto 647N (green). Dotted lines show the mean D coefficient extrapolation.

References

    1. Selvin PR, Ha T (2007) Single-Molecule Techniques: A Laboratory Manual: Cold Spring Harbor Laboratory Press. 507 p.
    1. Neuman KC, Nagy A (2008) Single-molecule force spectroscopy: optical tweezers, magnetic tweezers and atomic force microscopy. Nature methods 5: 491–505. - PMC - PubMed
    1. Joo C, Balci H, Ishitsuka Y, Buranachai C, Ha T (2008) Advances in single-molecule fluorescence methods for molecular biology. Annual review of biochemistry 77: 51–76. - PubMed
    1. Qu X, Wu D, Mets L, Scherer NF (2004) Nanometer-localized multiple single-molecule fluorescence microscopy. Proceedings of the National Academy of Sciences of the United States of America 101: 11298–11303. - PMC - PubMed
    1. Yildiz A, Selvin PR (2005) Fluorescence imaging with one nanometer accuracy: application to molecular motors. Accounts of chemical research 38: 574–582. - PubMed

Publication types

MeSH terms