

Met kinetic signature derived from the response to HGF/SF in a cellular model predicts breast cancer patient survival
- PMID: 23049908
- PMCID: PMC3457970
- DOI: 10.1371/journal.pone.0045969
Met kinetic signature derived from the response to HGF/SF in a cellular model predicts breast cancer patient survival
Abstract
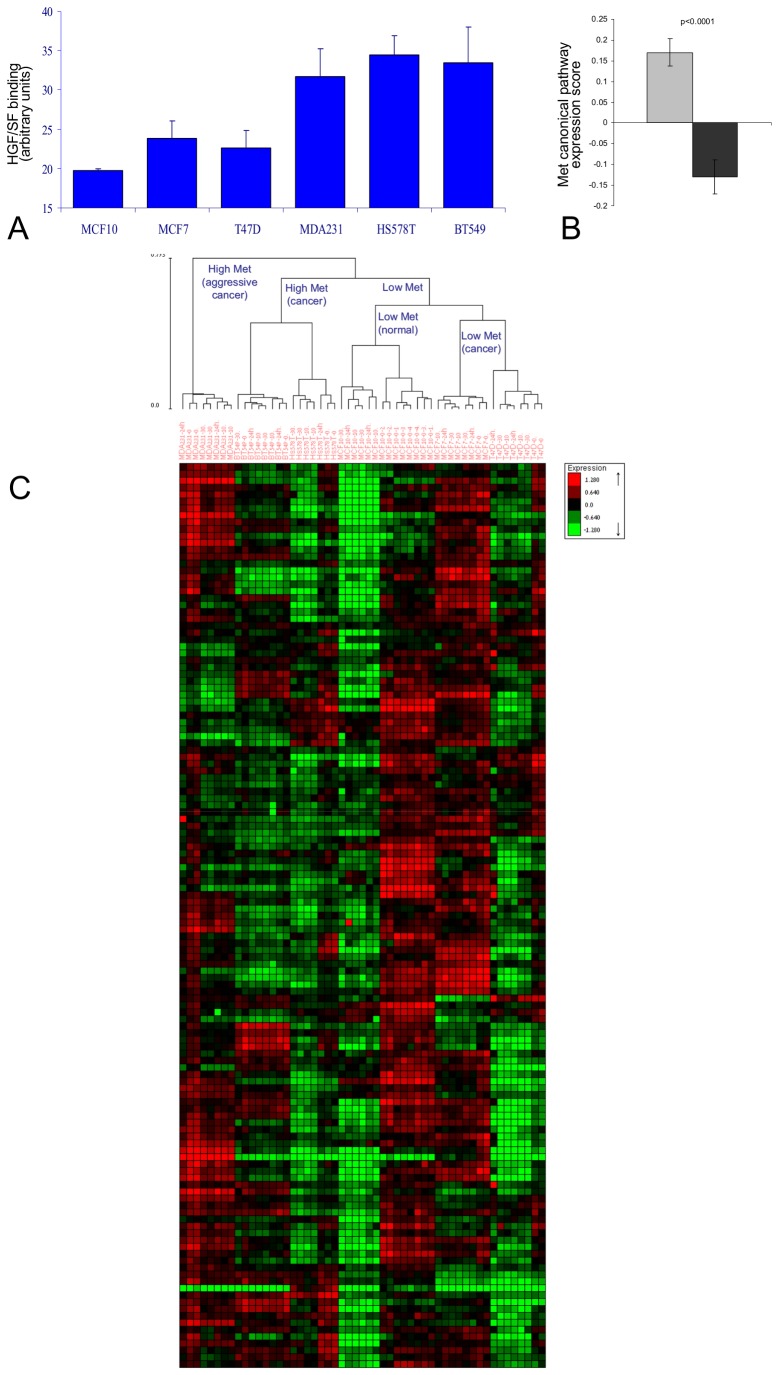
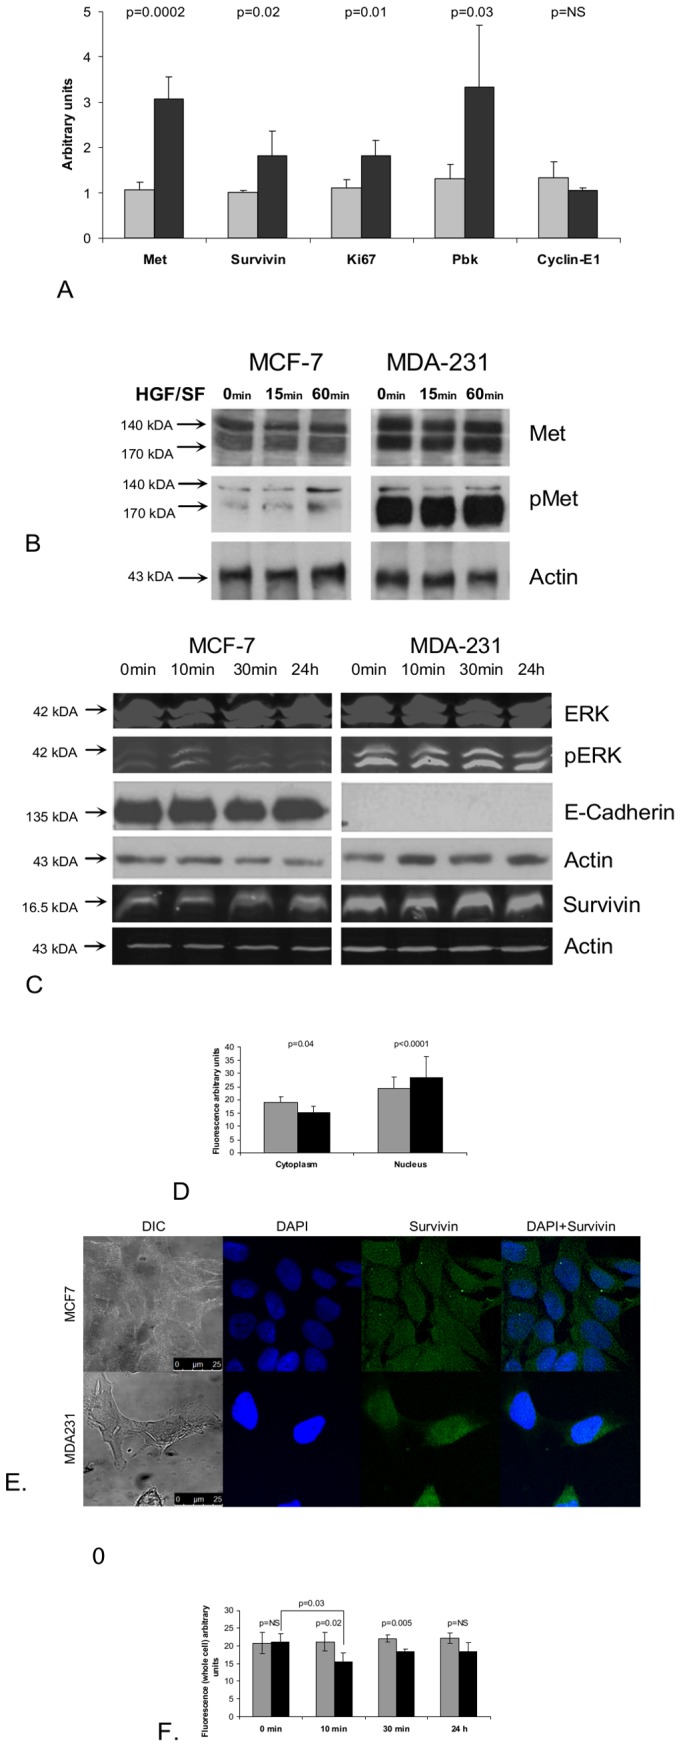
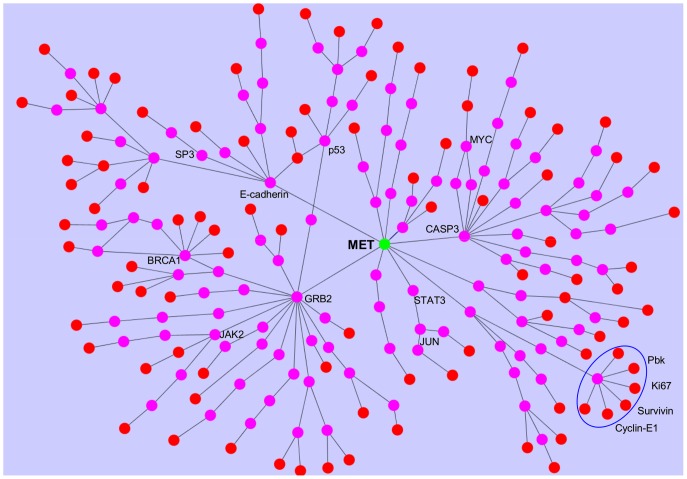
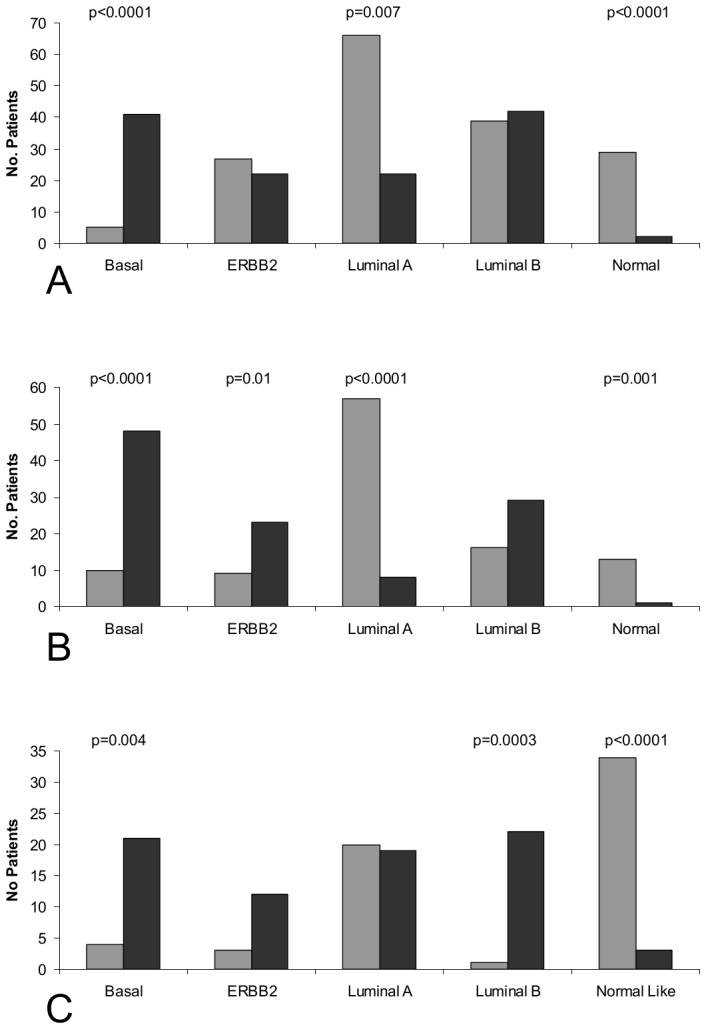
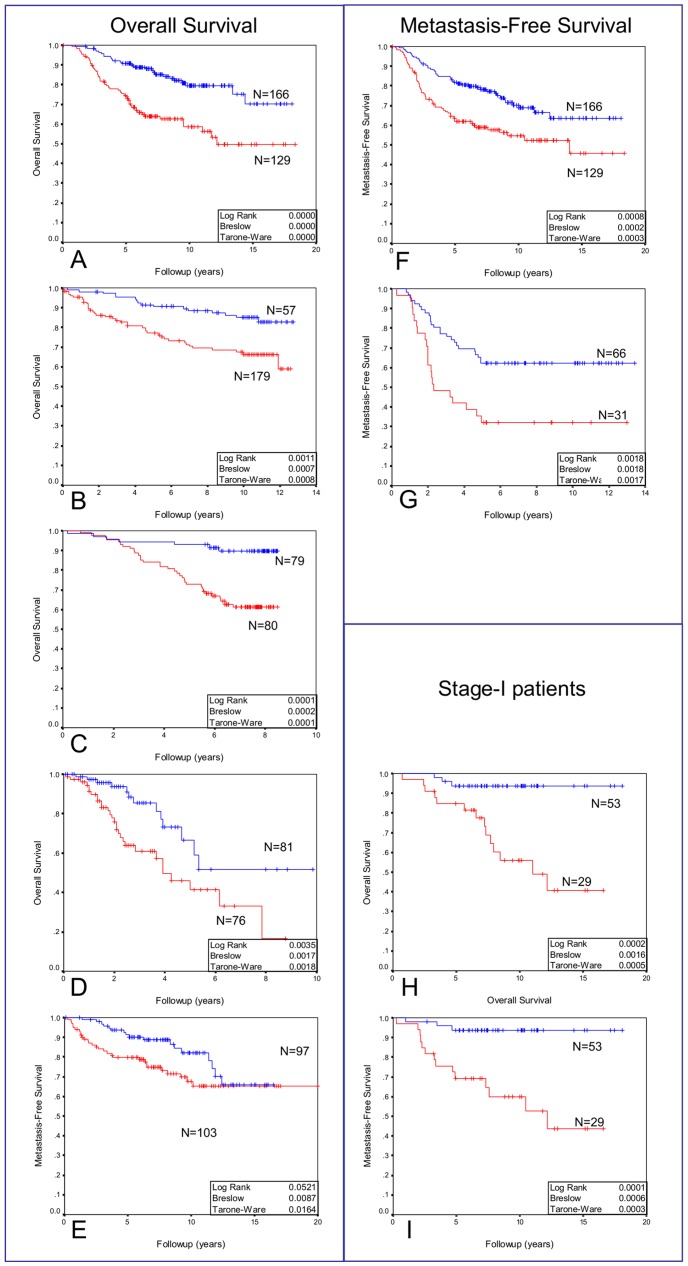
To determine the signaling pathways leading from Met activation to metastasis and poor prognosis, we measured the kinetic gene alterations in breast cancer cell lines in response to HGF/SF. Using a network inference tool we analyzed the putative protein-protein interaction pathways leading from Met to these genes and studied their specificity to Met and prognostic potential. We identified a Met kinetic signature consisting of 131 genes. The signature correlates with Met activation and with response to anti-Met therapy (p<0.005) in in-vitro models. It also identifies breast cancer patients who are at high risk to develop an aggressive disease in six large published breast cancer patient cohorts (p<0.01, N>1000). Moreover, we have identified novel putative Met pathways, which correlate with Met activity and patient prognosis. This signature may facilitate personalized therapy by identifying patients who will respond to anti-Met therapy. Moreover, this novel approach may be applied for other tyrosine kinases and other malignancies.
Conflict of interest statement
Figures
Similar articles
-
Breast tumor kinase and extracellular signal-regulated kinase 5 mediate Met receptor signaling to cell migration in breast cancer cells.Breast Cancer Res. 2010;12(4):R60. doi: 10.1186/bcr2622. Epub 2010 Aug 5. Breast Cancer Res. 2010. PMID: 20687930 Free PMC article.
-
C-Met overexpression in node-positive breast cancer identifies patients with poor clinical outcome independent of Her2/neu.Int J Cancer. 2005 Feb 10;113(4):678-82. doi: 10.1002/ijc.20598. Int J Cancer. 2005. PMID: 15455388
-
Mechanisms of HGF/Met signaling to Brk and Sam68 in breast cancer progression.Horm Cancer. 2012 Apr;3(1-2):14-25. doi: 10.1007/s12672-011-0097-z. Horm Cancer. 2012. PMID: 22124844 Free PMC article. Review.
-
Interaction between human-breast cancer metastasis and bone microenvironment through activated hepatocyte growth factor/Met and beta-catenin/Wnt pathways.Eur J Cancer. 2010 Jun;46(9):1679-91. doi: 10.1016/j.ejca.2010.02.036. Epub 2010 Mar 29. Eur J Cancer. 2010. PMID: 20350802
-
HGF/SF-met signaling in the control of branching morphogenesis and invasion.J Cell Biochem. 2003 Feb 1;88(2):408-17. doi: 10.1002/jcb.10358. J Cell Biochem. 2003. PMID: 12520544 Review.
Cited by
-
Activation of the c-Met Pathway Mobilizes an Inflammatory Network in the Brain Microenvironment to Promote Brain Metastasis of Breast Cancer.Cancer Res. 2016 Sep 1;76(17):4970-80. doi: 10.1158/0008-5472.CAN-15-3541. Epub 2016 Jun 30. Cancer Res. 2016. PMID: 27364556 Free PMC article.
-
Boswellia frereana suppresses HGF-mediated breast cancer cell invasion and migration through inhibition of c-Met signalling.J Transl Med. 2018 Oct 12;16(1):281. doi: 10.1186/s12967-018-1660-y. J Transl Med. 2018. PMID: 30314527 Free PMC article.
-
Analysis of circulating adipokines in patients newly diagnosed with solid cancer: Associations with measures of adiposity and tumor characteristics.Oncol Lett. 2017 Mar;13(3):1974-1982. doi: 10.3892/ol.2017.5670. Epub 2017 Feb 1. Oncol Lett. 2017. PMID: 28454352 Free PMC article.
References
-
- Bladt F, Riethmacher D, Isenmann S, Aguzzi A, Birchmeier C (1995) Essential role for the c-met receptor in the migration of myogenic precursor cells into the limb bud. Nature 376: 768–771. - PubMed
-
- Schmidt C, Bladt F, Goedecke S, Brinkmann V, Zschiesche W, et al. (1995) Scatter factor/hepatocyte growth factor is essential for liver development. Nature 373: 699–702. - PubMed
-
- Uehara Y, Minowa O, Mori C, Shiota K, Kuno J, et al. (1995) Placental defect and embryonic lethality in mice lacking hepatocyte growth factor/scatter factor. Nature 373: 702–705. - PubMed
-
- Rubin JS, Bottaro DP, Aaronson SA (1993) Hepatocyte growth factor/scatter factor and its receptor, the c-met proto-oncogene product. Biochim Biophys Acta 1155: 357–371. - PubMed
-
- Kamalati T, Niranjan B, Yant J, Buluwela L (1999) HGF/SF in mammary epithelial growth and morphogenesis: in vitro and in vivo models. J Mammary Gland Biol Neoplasia 4: 69–77. - PubMed
Publication types
MeSH terms
Substances
LinkOut - more resources
Full Text Sources
Medical
Molecular Biology Databases
Miscellaneous
